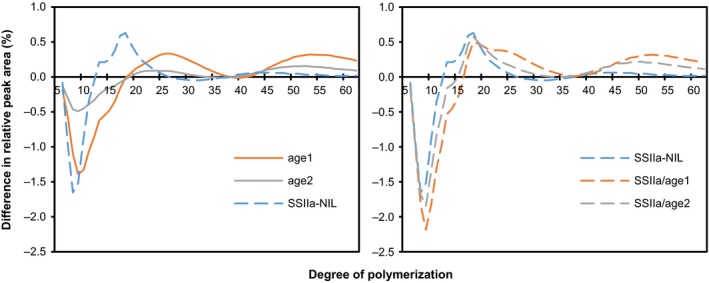
Figure 7.

Chain length distribution (CLD) patterns of amylopectin. CLD of amylopectin was examined by HPAEC‐PAD, and then the difference in the profiles between each line and Nipponbare was calculated by subtracting the ratio of a chain of given length of the sample with that of the mean value of Nipponbare. Values are the means of three replicates. The grains used for this experiment were ripened in the paddy field.
