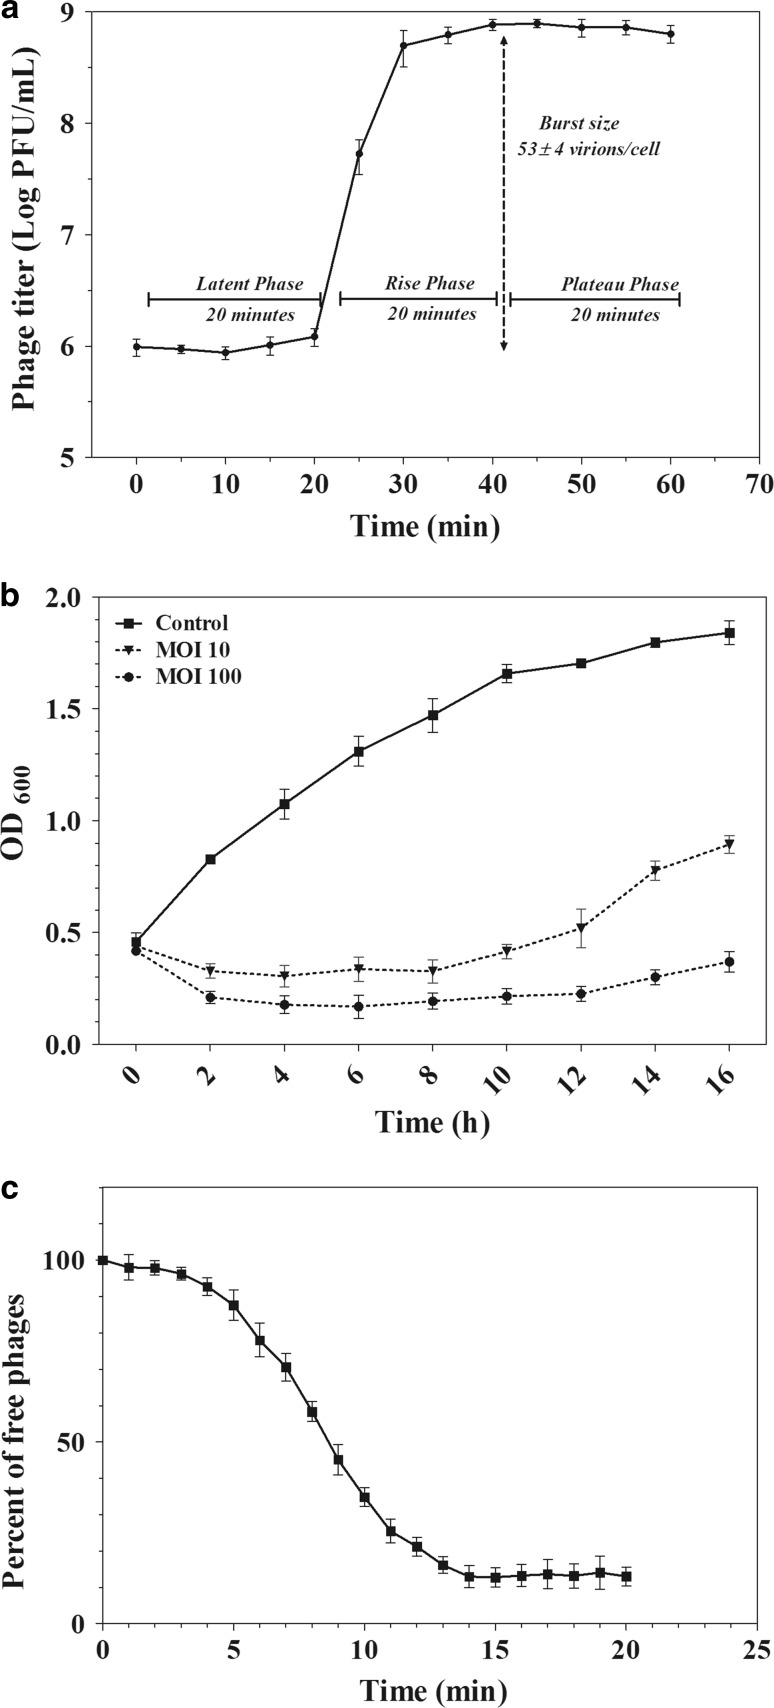
Fig. 3.
One step growth curve, reduction assay test and adsorption rate of vB_SflS-ISF001. a Latent period and burst size. b Effects of mid (MOI = 10) and high (MOI = 100) titers on the growth rate of S. flexneri. c phage adsorption rate. Values are the mean ± SD (standard deviation) from triplicate assays

