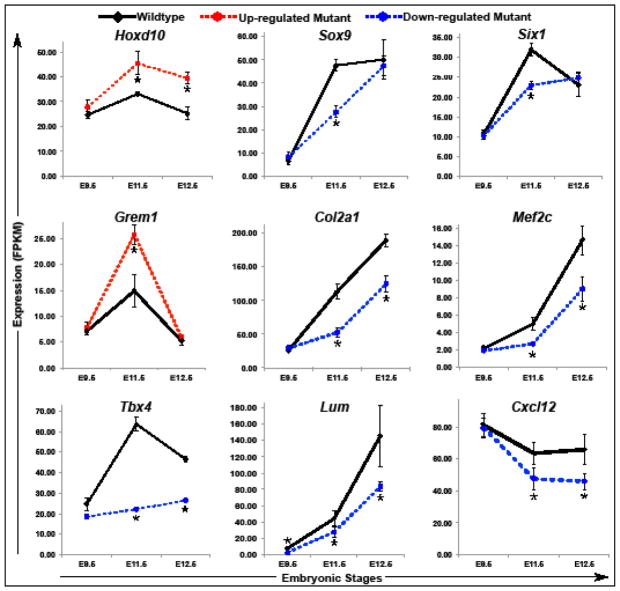
Fig. 4.
Expression levels of putative PITX1 transcriptional targets in wild-type and Pitx1−/− hindlimbs at different developmental stages. Time charts display the average RNA-Seq expression level from three independent biological replicates. Asterisks represent developmental stages with significantly different expression in Pitx1−/− compared to wild-type hindlimbs (FDR-adjusted p-value < 0.05). Error bars represent the standard error of the mean.

