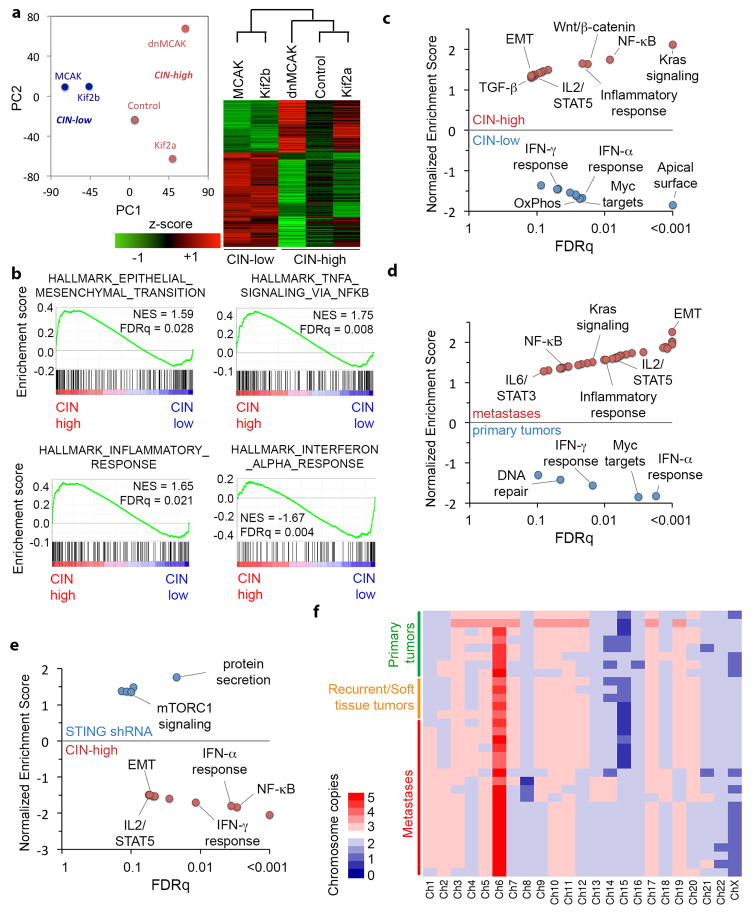
Extended Data Figure 4. Transcriptional consequences of CIN in cancer cells.
a–b, Principle component analysis (PCA) (left) and unsupervised clustering (right) of 5 MDA-MB-231 cell lines expressing different kinesin-13 proteins based on bulk RNA expression data. b–e, Gene set enrichment analysis (GSEA) results showing HALLMARK gene sets that are highly enriched in CIN-high (control, Kif2a, and dnMCAK) compared with CIN-low cells (MCAK and Kif2b) cells (b–c) or STING-depleted cells (e), or after comparing metastases with primary tumors (d), significance tested using one-sided Weighted Smirnov-Kolmogorov test corrected for multiple tests. f, Heatmap of consensus chromosomal karyotypes of cells derived from primary tumors and metastases showing selective increase in chromosome 1 copy number in metastases compared with primary tumors.

