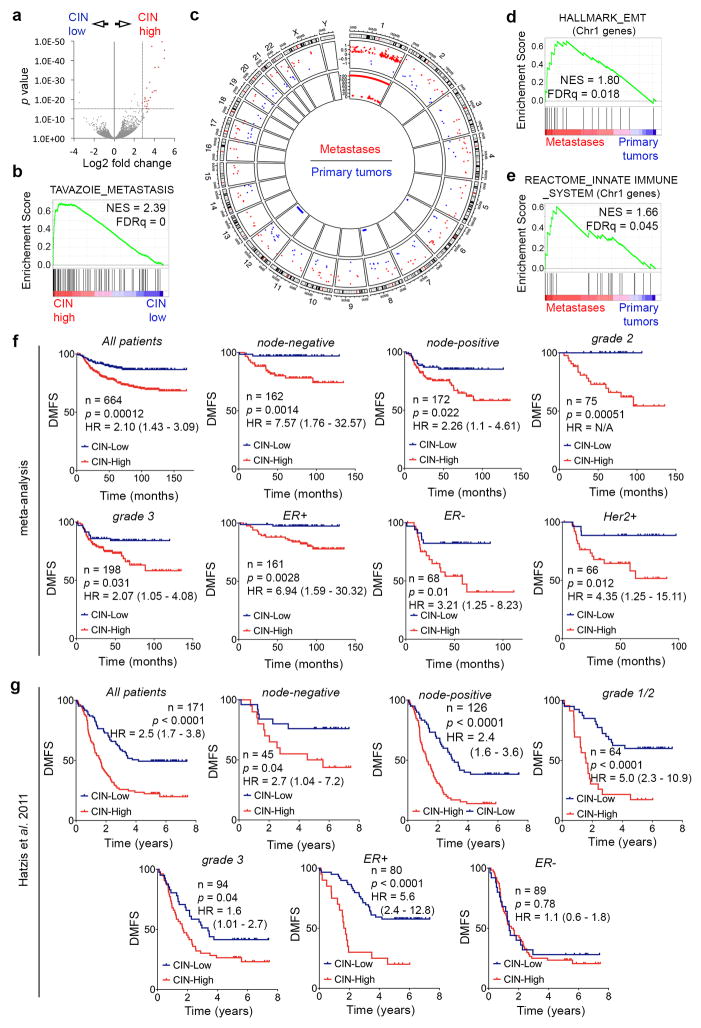
Extended Data Figure 5. Prognostic impact of the CIN signature.
a, Volcano plot showing differentially expressed genes between CIN-high and CIN-low MDA-MB-231 cells. Red data points denote genes subsequently used for determining the CIN signature. b–e, Enrichment plots for all differentially expressed genes (a) or those on Chromosome 1 (d–e). Circos plot (c) showing genomic location (outer circle), log2-fold expression of genes significantly differentially expressed in metastases compared to primary tumors (middle circles), and the log10(p value, inner circle) for genomic amplifications (red) or deletions (blue) in metastases relative to primary tumors. n = 2 (CIN-low), 3 (CIN-high), 11 (primary tumors), 28 (metastases). Significance tested using two-sided Wald test (a), one-sided Weighted Smirnov-Kolmogorov test (b, d, e), and one-sided hypergeometric test (c) all corrected for multiple testing. f–g, DMFS of breast cancer patients stratified by lymph node status, grade, and receptor status, from a meta-analysis (f, n = 664 patients) or a validation cohort (g, n = 171 patients) divided based on their average expression of the CIN gene expression. Significance tested using two-sided log-rank test.

