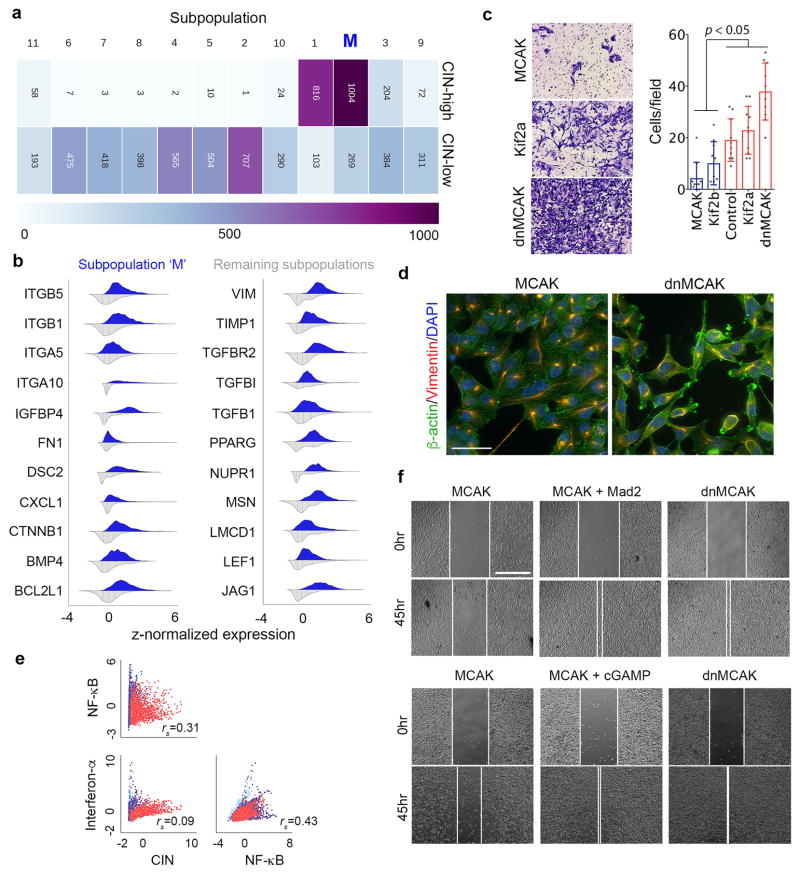
Extended Data Figure 6. Single-cell sequencing and population detection.
a, The cellular composition of every subpopulation presented Figure 4b. b, Violin plots showing expression probability density of key metastasis and invasion genes in a subpopulation of cells (n = 1273 cells) enriched for EMT and CIN genes (subpopulation ‘M’) compared with the remaining subpopulations (n = 5548 cells) that were identified using graph-based unsupervised K-nearest neighbor embedding. c, Representative low-power field images (left) and numbers (right) of MDA-MB-231 cells which invaded through a collagen membrane within 18 hours of culture. Bars represent mean ± SD, Significance tested using two-sided Mann Whitney test, n = 10 high-power fields, 2 independent experiments. d, Representative images of MDA-MB-231 cells expressing MCAK or dnMCAK stained for β-actin, Vimentin, and DNA scale bar 50-μm, n = 2 independent experiments. e, Single-cell correlation plots between CIN signature genes, canonical NF-κB and type I interferon target genes, n = 6,821 cells. e, Representative phase-contrast images of a wound-healing assay of cells MCAK, MCAK+mad2 or dnMCAK expressing MDA-MB-231 cells and MCAK cells treated with cGAMP, scale bar 800-μm, 4 experiments.

