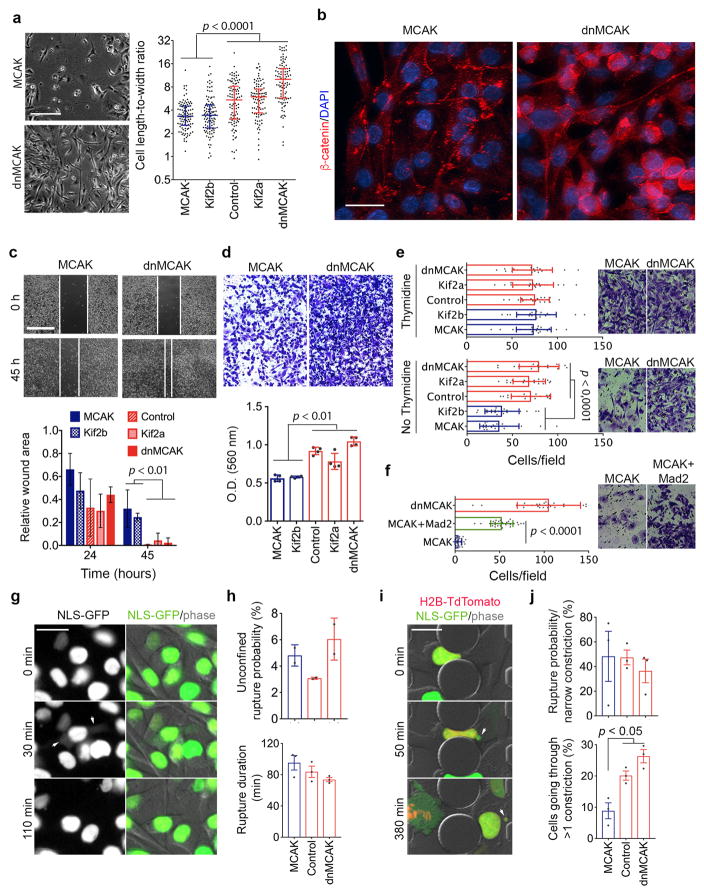
Extended Data Figure 7. CIN promotes in vitro invasion and migration.
a, Left, representative phase contrast images of MDA-MB-231 cells in the wound area, 36-hours after wound creation, 4 experiments. Right, length-to-width ratio of cells expressing different kinesin-13 proteins. Bars span the interquartile range, n = 100 cells, 2 independent experiments, significance tested using two-sided Mann Whitney test. b, Representative MDA-MB-231 cells stained for β-catenin (anti-β-catenin antibody) or DNA (DAPI). Changes in β-catenin are seen upon alteration of CIN; enriched at cell-to-cell junctions in MCAK expressing cells but cytoplasmic and nuclear in dnMCAK expressing cells, scale bar 30-μm, 2 experiments. c, Above, Phase-contrast images of a wound-healing assay of cells expressing kinesin-13 proteins, scale bar 800-μm, 2 experiments. Bottom, Wound area (normalized to the 0h time point) 24h and 45h after wound creation, bars represent mean ± SD, n = 4 experiments, significance tested using two-sided t-test. d, Above, Low-power field images of MDA-MB-231 cells that have migrated through a polycarbonate membrane containing 8-μm pores within 18 hours of culture. Below, Normalized O.D. of cells scraped from the bottom of the membrane, bars represent mean ± s.e.m., significance tested using two-sided t-test, n = 3 experiments. e–f, Left, Number of MDA-MB-231 cells that have successfully invaded through a collagen basement membrane 24 hours after plating. Bars represent mean ± SD, n = 20 high power fields from 2 independent experiments, significance tested using two-sided Mann-Whitney test. Right, representative images from high-power fields, 2 independent experiments. g, i, Representative time-lapse fluorescence and phase-contract image sequences of control cells expressing NLS-GFP undergoing unconfined migration (g) or going through 1×5 μm2 constrictions (i). Scale bar 20-μm. Arrows in (g) indicate cytoplasmic NLS-GFP. Arrows in (i) indicate formation of nuclear protrusion and subsequently fragment during confined migration, 3 independent experiments. h, j, The probability of primary nuclear rupture during unconfined conditions (h, top) or after migration through 1×5 μm2 wide constrictions (j, top). The number of cells migrating through more than one 1-μm wide constrictions (j, bottom) and the duration of nuclear rupture (h, bottom) as measured by the length of time in which NLS-GFP signal is observed in the cytosol. Bars represent mean ± s.e.m., n = 3 independent experiments (except for unconfined rupture probability – 2 independent experiments) encompassing 390–665 (h) and 150–336 (j) cells observed during unconfined and confined migration, respectively, significance tested using two-sided t-test.

