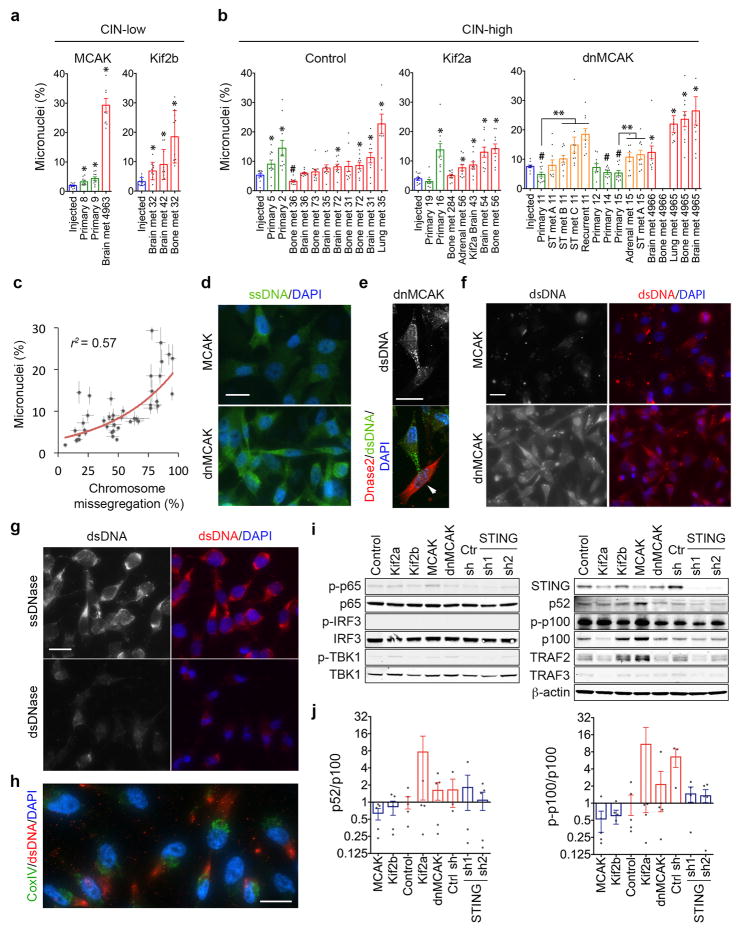
Extended Data Figure 8. CIN generates micronuclei and cytosolic DNA.
a–b, Percentage of micronuclei in samples depicted in Figure 3c–d: injected cells (blue), first-passage cells derived from primary tumors (green), or metastases (orange denotes spontaneous metastases arising from primary tumors, red denotes metastases obtained from direct intracardiac implantation). Bars represent mean ± s.e.m., n = 10 high-power fields encompassing 500–1500 cells/sample, 3 independent experiments, * p < 0.05 and denotes samples with higher missegregation rates than the injected lines, # p < 0.05 and denotes samples with lower missegregation rates than the injected lines, ** p < 0.05 and it denotes significant differences between metastases and matched primary tumors from the same animals, two-tailed t-test. c, Correlation between the percentage of cells exhibiting evidence of chromosome missegregation and percentage of micronuclei in all injected cell lines as well as cells derived from primary tumors and metastases. Data points represent mean ± s.e.m., n = 44 samples. d–f, Representative images of cells stained for DNA (DAPI), cytosolic single-stranded DNA (ssDNA) (d), Dnase2 (RFP reporter) (e), or cytosolic double-stranded DNA (dsDNA) (f), scale bar 20-μm, arrows in e denote Dnase2 expressing cell, 2 independent experiments. g, Representative images of dnMCAK expressing cells treated with ssDnase or dsDnase for 10 min. after selective plasma membrane permeabilization (using 0.02% saponin) stained for DNA (DAPI) and cytosolic dsDNA, scale bar 20-μm, one experiment. h, Representative images of dnMCAK expressing cells stained for mitochondria (using anti-CoxIV antibody), DNA (DAPI) or for cytosolic DNA (using anti-dsDNA antibody), scale bar 20-μm, 2 independent experiments. i, Immunoblots of lysates from cells expressing different kinesin-13 proteins, control or STING shRNA, β-actin used as a loading control. j, Normalized ratio of phosphorylated p52-to-p100 (left) and p100-to-total p100 (right) protein levels. Bars represent mean ± s.e.m., n = 5 independent experiments.

