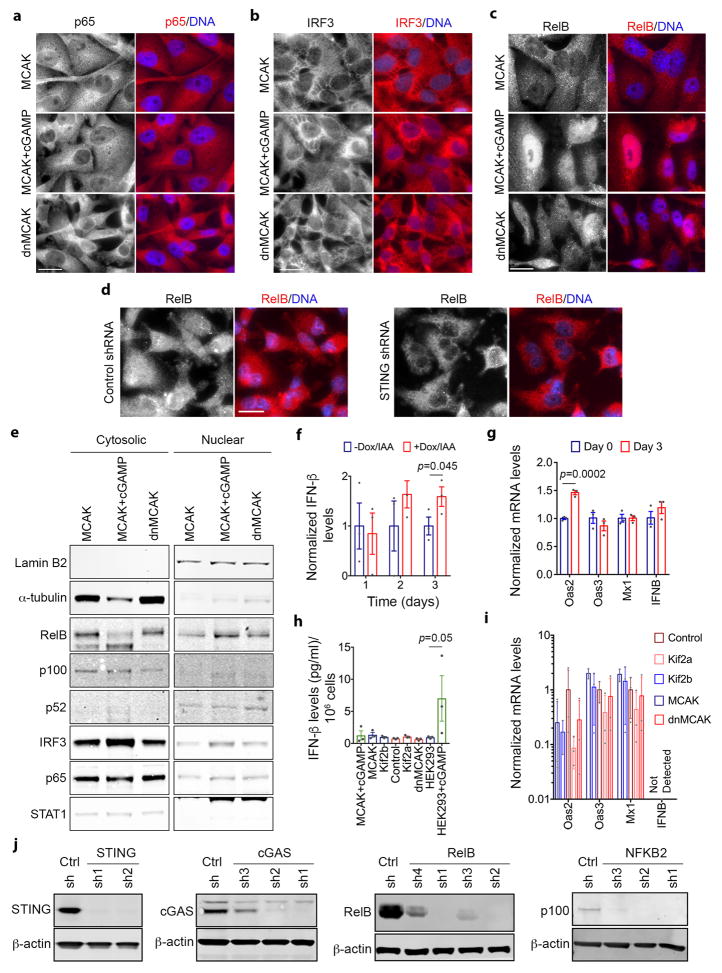
Extended Data Figure 9. Alternative response to cytosolic DNA in cancer cells.
a–d, Representative images of MDA-MB-231 cells stained for DNA (DAPI), and for p65 (a), IRF3 (b), or RelB (c–d). Images were individually contrast-enhanced to emphasize nuclear versus cytosolic localization of p65, IRF3, and RelB. For quantitative comparisons of the identical images, please refer to Supplementary Figure 3. Arrows (c–d) point to RelB-positive nuclei, scale bars, 20-μm, 3 independent experiments. e, Immunoblots of fractionated lysates. a-tubulin and Lamin B2 were used as loading controls for the cytoplasmic and nuclear fractions, respectively, 3 independent experiments. f, h, Interferon-β levels in conditioned media from DLD-1 cells (f) MDA-MB-231 or HEK293 cells with and without cGAMP addition (h). Bars represent mean ± s.e.m. n = 3 experiments, significance tested using one-sided Mann-Whitney test. g, i, Relative levels of interferon responsive genes obtained by RT-qPCR, DLD-1 cells (g) normalized to untreated conditions or MDA-MB-231 cells (i) normalized to control cells. Bars represent mean ± SD n = 3 experiments, significance tested using 2-sided t-test. j, Immunoblots of lysates of dnMCAK expressing cells that also co-express control shRNA or shRNAs targeting components of cytosolic DNA sensing or the noncanonical NF-κB pathway. shRNA hairpins are numbered in ascending order based on the efficiency of the protein knockdown, 2 independent experiments.

