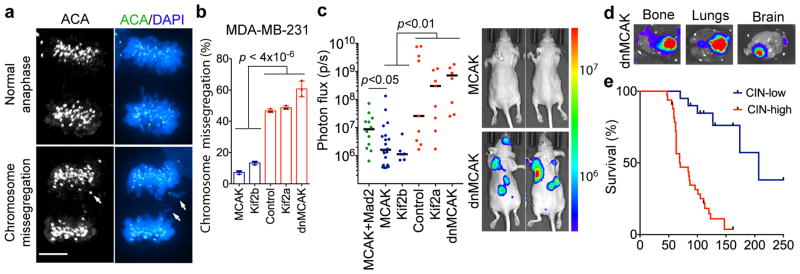
Figure 2. CIN is a driver of metastasis.
a, Anaphase cells stained for centromeres and DNA, scale bar 5-μm. b, Chromosome missegregation in cells expressing kinesin-13 proteins. Bars represent mean ± SD, n = 150 cells. c, Whole animal bioluminescence (BLI) 7 weeks after intracardiac injection of MDA-MB-231 cells. Bars represent the median, n = 12 (MCAK+Mad2), 20 (MCAK), 7 (Kif2b), 9 (control), 9 (Kif2a), 8 (dnMCAK) mice. d, Ex-vivo BLI of organs with metastases from MDA-MB-231 cells expressing dnMCAK. e, Disease-specific survival of mice injected with CIN-high (n = 33) or CIN-low (n = 20) MDA-MB-231. Significance tested using two-sided t-test (b), two-sided Mann Whitney test (c), and two-sided log-rank test (e) n = 3 (a–b) and 5 (d) independent experiments. Throughout the manuscript, pairwise comparisons between individual CIN-low and CIN-high conditions are smaller than the stated p value.

