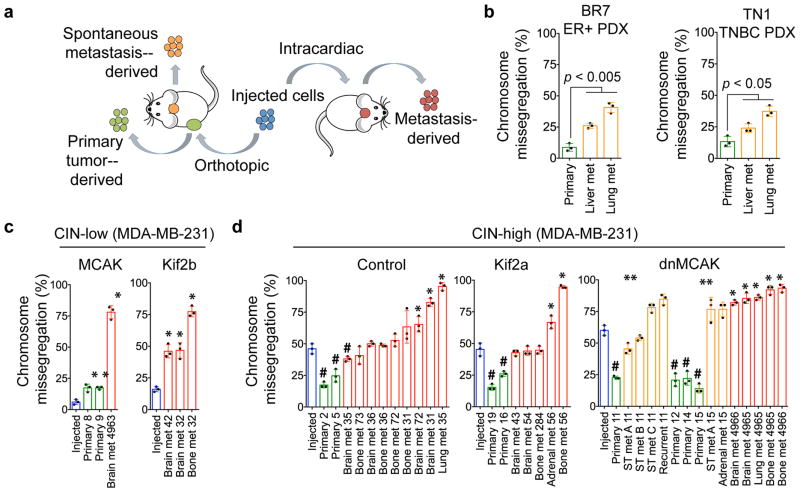
Figure 3. Opposing roles for CIN in primary tumors and metastases.
a, Experimental schema. b–d, Chromosome missegregation in injected cells (blue), cells derived from primary tumors (green), metastases (met) arising spontaneously (orange) or after intracardiac injection (red). ST, soft tissue. Bars represent mean ± SD, n = 150 cells, 3 independent experiments, *p < 0.05, #p < 0.05, **p < 0.05 denote samples with higher or lower chromosome missegregation than the injected lines, and spontaneous metastases with higher missegregation than matched primary tumors, respectively. Significance tested using two-sided t-test (b–d).

