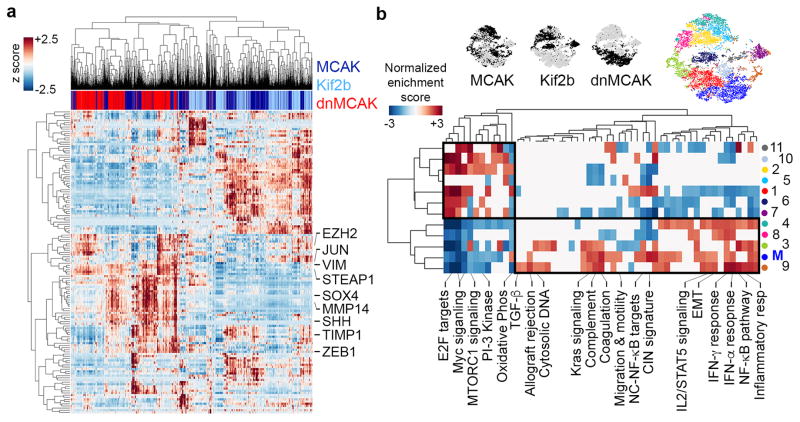
Figure 4. CIN enriches for mesenchymal cell traits.
a, Heatmap showing expression of EMT genes in 6,821 MCAK, Kif2b, and dnMCAK expressing MDA-MB-231 cells. b, Above, t-stochastic neighbor embedding (tSNE) projection of all cells in a. Below, Heatmap of normalized enrichment score (NES) for pathways with an FDRq < 0.05 based on GSEA using one-sided Weighted Smirnov-Kolmogorov test on subpopulations identified using Phenograph. Boxes outline populations with mutually exclusive transcriptional profiles.

