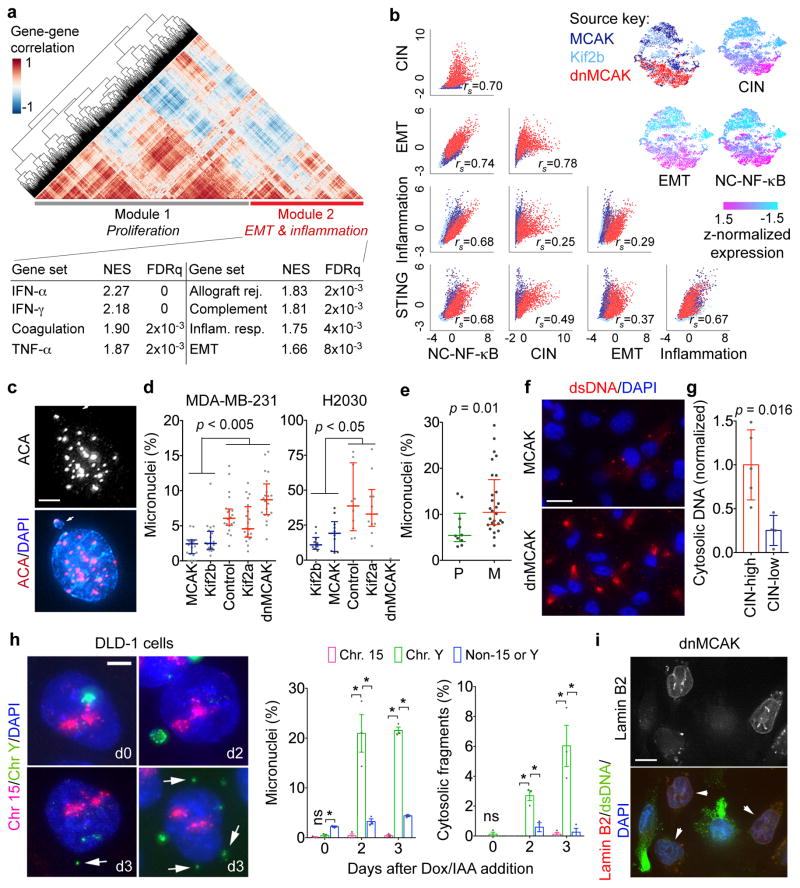
Figure 5. CIN generates cytosolic DNA.
a, Heatmap showing gene-gene correlations in 6,821 cells and HALLMARK gene sets significantly enriched in Module 2, one-sided Weighted Smirnov-Kolmogorov test. b, Top right, normalized expression level of key gene signatures in 6,821 MCAK, Kif2b, and dnMCAK expressing MDA-MB-231 cells. Bottom left, Correlation plots for key gene signatures. c, A primary nucleus and a micronucleus stained for centromeres and DNA, scale bar 5-μm. d–e, Percentage of micronuclei cells expressing various kinesin-13 proteins (d) or in cells derived from 10 primary tumors and 28 metastases (e). n = 20 high-power fields per sample (d) or average values derived from 10 high-power fields per sample (e). f, MCAK and dnMCAK expressing MDA-MB-231 cells stained using DAPI and anti-dsDNA antibody, scale bar 20-μm. g, Cytosolic-to-nuclear DNA ratios in CIN-high (n = 5) and CIN-low (n = 4) MDA-MB-231 (n = 5) and H2030 (n = 4) cells. h, Left, DLD-1 cells stained for DNA and hybridized to chromosome-specific FISH probes, scale bar 5-μm. Right, Percentage of cells containing micronuclei or small cytosolic DNA fragments (n >500 cells per condition). i, MDA-MB-231 cells stained using DAPI, anti-dsDNA antibody, or mCherry-Lamin B2 (arrow), scale bar 10-μm. Bars represent median ± inter-quartile range (d–e), mean ± SD (g), mean ± sem (h). n = 6 (c–d), 3 (e–f, h), 1 (g) and 2 (i) independent experiments. Significance tested using two-sided Mann-Whitney test (d–e) or two-sided t-test (g–h), * p <0.05.

