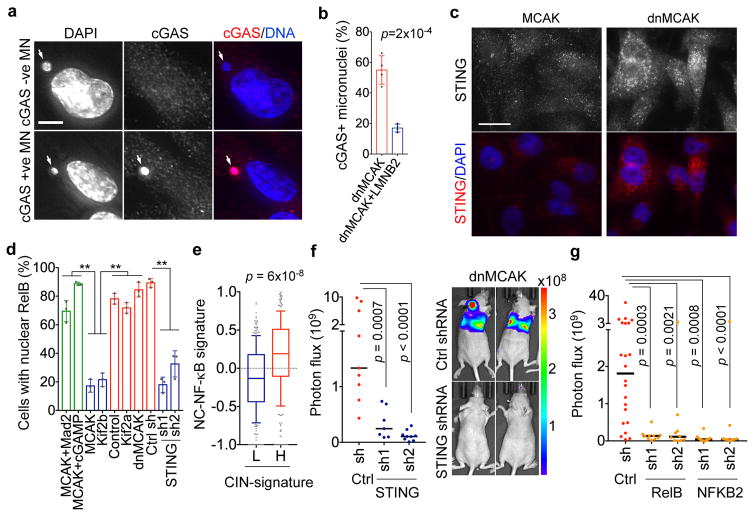
Figure 6. Metastasis from a cytosolic DNA response.
a, MDA-MB-231 cells stained for DNA and cGAS, scale bar 5-μm. b, Percentage of micronuclei with (cGAS+) or without (cGAS-) cGAS localization, n = 200 cells. c, Cells stained for DNA and STING, scale bar 20-μm. d, Percentage of MDA-MB-231 cells with nuclear RelB, n = 150 cells. e, Average z-normalized expression of CIN-responsive noncanonical NF-κB target genes in breast cancer patients with low (<30th percentile, n = 330) or high (>30th percentile, n = 332) CIN gene expression signature. f–g, Photon flux (p/s) of whole animals after intracardiac injection with MDA-MB-231 cells expressing control shRNA, STING shRNA (f), RelB shRNA (g) or NFKB2 shRNA (g), n = 9, 7, and 9 mice for the control, STING shRNA1, and STING shRNA2 groups, respectively (f), n = 22, 10, 10, 10, and 9 mice for the control, RelB shRNA1, RelB shRNA2, NFKB2 shRNA1, and NFKB2 shRNA2 groups, respectively (g). Bars represent mean ± SD (b, d), median ± interquartile range with bars spanning 10th–90th percentile (e), median (f–g), significance tested using two-sided t-test (b, d), two-sided Mann Whitney test (e–g), n = 4 (a–b), and 3 (c–d) independent experiments.

