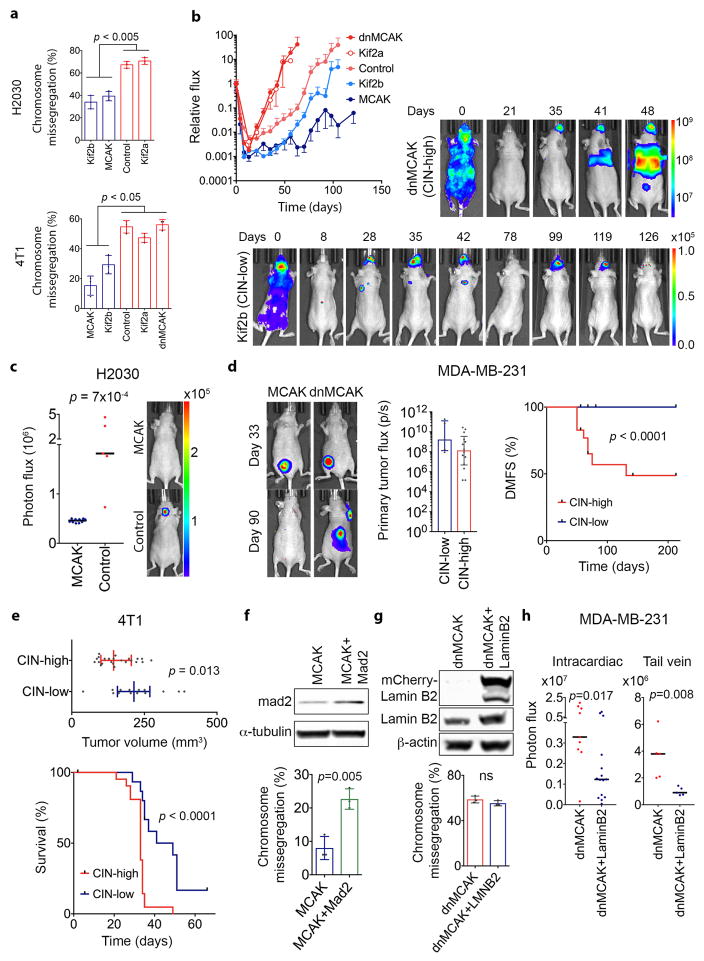
Extended Data Figure 3. CIN promotes formation and maintenance of metastasis.
a, Chromosome missegregation in H2030 and 4T1 cells expressing kinesin-13 proteins. Bars represent mean ± SD, n = 150 cells, 3 independent experiments, significance tested using two-sided t-test. b, Left, Normalized photon flux over time of whole animals injected with MDA-MB-231 cells expressing kinesin-13 proteins Bars represent mean ± s.e.m. n = 8 (MCAK), 7 (Kif2b), 5 (Control), 4 (Kif2a), and 9 (dnMCAK) mice per group, 3 independent experiments. Right, Mice injected with MDA-MB-231 cells expressing dnMCAK (above) or Kif2b (below) where disease burden was tracked using BLI, 3 independent experiments. c, Photon flux (p/s) of whole animals imaged 5 weeks after intracardiac injection with control or MCAK expressing H2030 cells. Bars represent the mean, significance tested using two-sided Mann Whitney test, n = 10 mice in the MCAK group and 5 mice in the control group. d, Left, Representative BLI images from two independent experiments of mice orthotopically transplanted with MDA-MB-231 cells before (Day 33) and after (Day 90) tumor excision. Metastasis can be detected in the mouse transplanted with dnMCAK expressing cells at day 90. Middle, Total flux (p/s) emitted from primary tumors 52 days after transplantation. Bars represent mean ± SD, n = 5 (CIN-low) and 14 (CIN-high) mice, p = 0.13, two-sided Mann Whitney test. Right, Distant metastasis-free survival (DMFS) of mice orthotopically transplanted with MDA-MB-231 cells with various levels of CIN. n = 15 (CIN-low) and 29 (CIN-high) mice, pairwise significance tested with two-sided log-rank test. e, Tumor volume at 8 days (top) and survival (bottom) of mice transplanted with murine 4T1 cells in the mammary fat pad. Bars represent median ± interquartile range, pairwise significance tested with two-sided t-test (top) and two-sided log-rank test (bottom). n = 20 (CIN-low) and 30 (CIN-high) mice. f, Top, immunoblots of MCAK or MCAK and mad2 overexpressing MDA-MB-231 cells stained for mad2 using anti-mad2 antibody with a-tubulin used as a loading control, 3 independent experiments. Bottom, Percentage of anaphase cells exhibiting evidence of chromosome missegregation in MCAK or MCAK and mad2 overexpressing cells, bars represent mean ± SD, n = 150 cells, 3 experiments, significance tested using two-sided t-test. g, Top, immunoblots of dnMCAK or dnMCAK and Lamin B2 overexpressing MDA-MB-231 cells stained for Lamin B2 using anti-Lamin B2 antibody with β-actin used as a loading control, 2 experiments. Bottom, Percentage of anaphase cells exhibiting evidence of chromosome missegregation in dnMCAK or dnMCAK and Lamin B2 overexpressing cells, bars represent mean ± SD, n = 150 cells, 3 experiments, significance tested using two-sided t-test. h, Photon flux (p/s) of whole animals after intracardiac (left) or tail vein (right) injection with dnMCAK or dnMCAK and Lamin B2 expressing MDA-MB-231 cells. Bars represent the median, significance tested using two-sided Mann Whitney test, n = 9 (dnMCAK), 15 (dnMCAK and Lamin B2) mice in the intracardiac injection cohort and 5 mice per group in the tail vein injection cohort.

