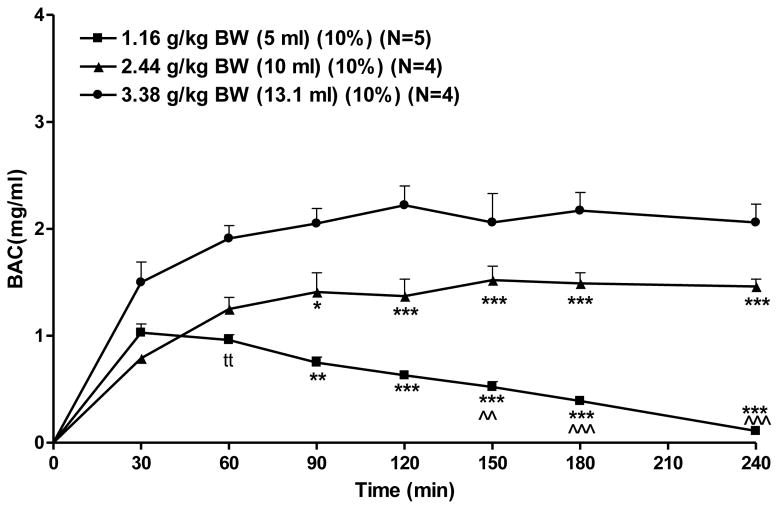
Figure 5.
Effect of alcohol dose and volume on BAC. Rats were infused with one of 3 doses of alcohol with dose achieved by varying volume while holding alcohol concentration constant at 10%. Each point represents the mean ± S.E. *=p<0.05, **=p<0.01, ***=p<0.001 vs 3.38g/kg BW by Fisher’s LSD; ^^=p<0.05, and ^^^=p<0.001 vs 2.44g/kg BW by Fisher’s LSD; tt=p<0.01 vs 3.38g/kg BW by t-test.

