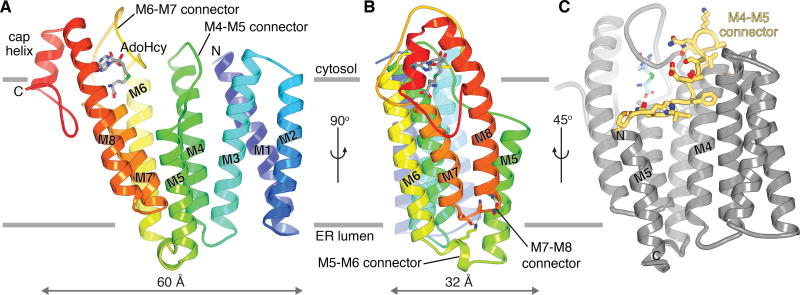
Figure 1. Architecture of ICMT.
a, Ribbon representation with secondary structure elements coloured blue-to-red from the N- to the C-terminus. Horizontal bars indicate approximate boundaries of the ER membrane. b, Orthogonal view, showing interactions between the M5–M6 and M7–M8 connectors (sticks with hydrogen bonds drawn as dashed lines). c, View highlighting the location of the M4–M5 connector (yellow with drawn side chains).

