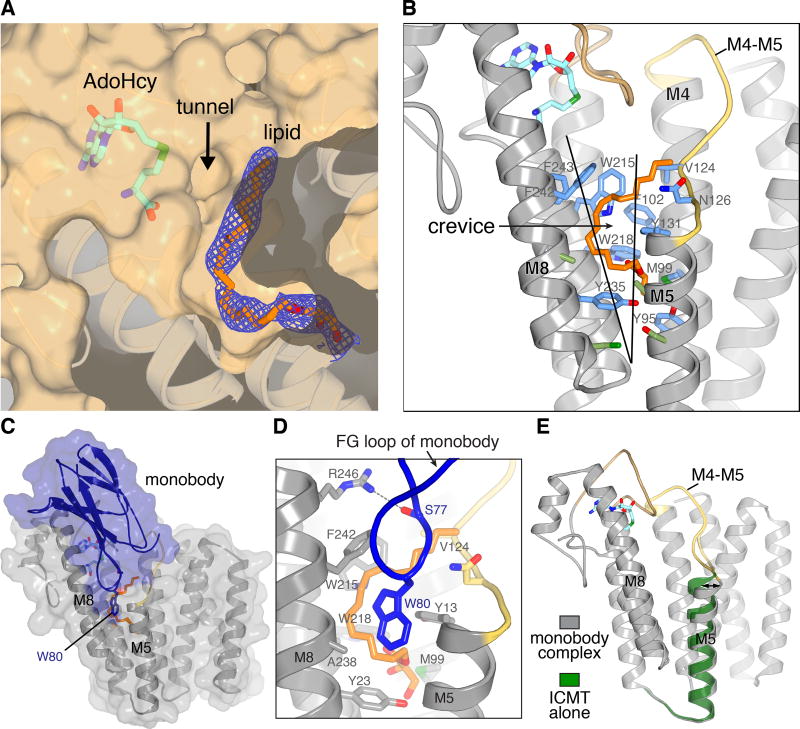
Figure 3. Lipid-binding cavity and monobody complex.
a, The active site cavity containing a lipid molecule. Electron density (blue mesh, 2Fo-Fc map contoured at 1 σ) for a monoolein lipid (orange sticks) is shown on a cutaway view of the molecular surface (tan). The tunnel between AdoHcy (sticks) and the lipid-binding cavity is indicated. Helices below the surface are depicted as ribbons. b, The crevice and amino acids comprising the lipid-binding cavity. A portion of ICMT is depicted as ribbons with the M4–M5 connector coloured yellow and the M6–M7 connector coloured tan. The crevice between M5 and M8 is indicated by a wedge. Amino acids within van der Waals distances of the lipid are coloured blue; those that line the crevice are green c, Monobody complex. A semi-transparent representation of the molecular surface of the complex (ICMT, gray; monobody, blue) is shown surrounding ribbon representations. d, Close up view of the FG loop of the monobody (blue) interacting with ICMT (predominately grey). Trp80 and Ser77 of the monobody are shown as sticks. A hydrogen bond between Ser77 and Arg246 of ICMT is shown as a dashed line. The monoolein molecule (orange) and ICMT residues surrounding it are shown as sticks. e, Comparison of structures with and without the monobody (coloured as indicated). An arrow highlights the tilting of M5; otherwise the overall structures are indistinguishable.

