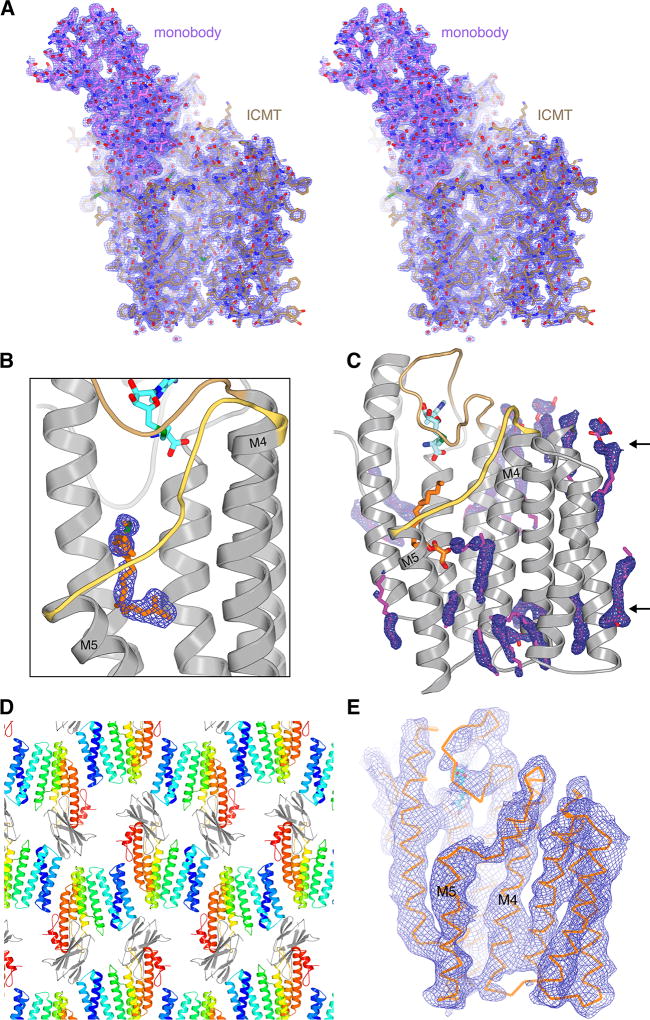
Extended Data Figure 3. Electron density maps and crystal lattice.
a, Stereo representation of the electron density for the ICMT-monobody complex (blue mesh, 2Fo - Fc, 1.1 σ contour, calculated from 35 to 2.3 Å resolution) drawn around the atomic model (stick representation). The monobody is coloured magenta; ICMT is tan. b, Electron density for the lipid in the active site from a composite simulated annealing omit electron density map (2Fo-Fc, contoured at 1 σ and calculated from 35 – 2.3 Å resolution). The density would accommodate a geranylgeranyl lipid (orange sticks), as shown in this figure. c, Electron density (blue mesh; 2Fo-Fc map contoured at 1 σ) for ordered monoolein lipids (magenta sticks) around ICMT. Monoolein lipids surround the transmembrane region of ICMT and collectively resemble a bilayer with typical thickness (arrows). The positioning of monoolein lipids in the vicinity of the M4–M5 connector (yellow) are consistent with the hypothesis that the enzyme would cause a slight depression in the membrane in this region, as illustrated in Extended Data Figure 9. d, Crystal lattice in the ICMT-monobody complex, with ICMT coloured and the monobody in gray. e, A composite omit electron density map (2Fo-Fc, contoured at 1 σ and calculated from 35 – 4.0 Å resolution) for the X-ray structure of ICMT without the monobody. The composite omit maps, which reduce model-bias, were obtained using Phenix36.

