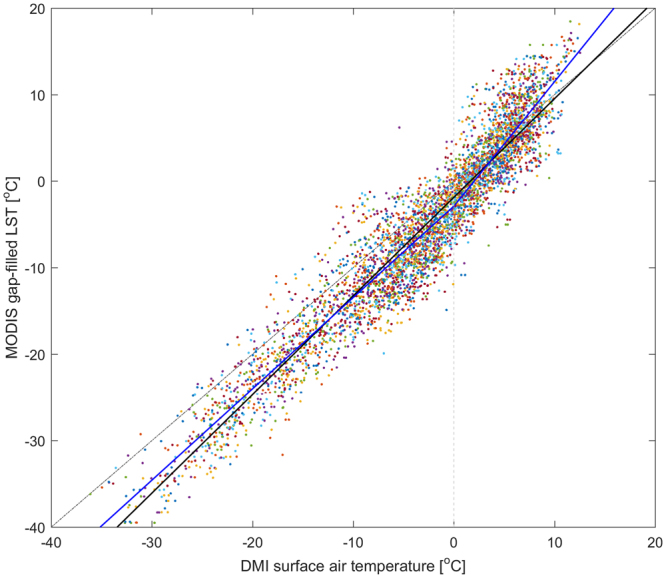
Figure 2.

Monthly averages of gap-filled MODIS land surface temperatures (LST) and observed air temperatures at Danish Meteorological Institute (DMI) stations for the period 2001–2014. The dashed gray line displays the 1:1 relation. The solid black line is a highly significant ordinary least squares (OLS) linear regression function (p < 0.001, t-test; slope = 1.14; intersect = −1.87; RMSE = 3.33). The OLS function explains 91% of the variation (R2 = 0.91). The solid blue line is a stepwise OLS function, with a knot at 0 °C air temperature (dashed vertical line) (p < 0.001, t-test; knots(x) = [−40, 0, 20]; coefficients(y) = [−45.14; −2.90; 25.88]; RMSE = 3.21). Both functions illustrate the quality of MODIS LST data as a proxy for air temperatures in complex terrains. Each scatter-plot color refers to single DMI stations, illustrating an even distribution of temperatures across the stations.
