Figure 7.
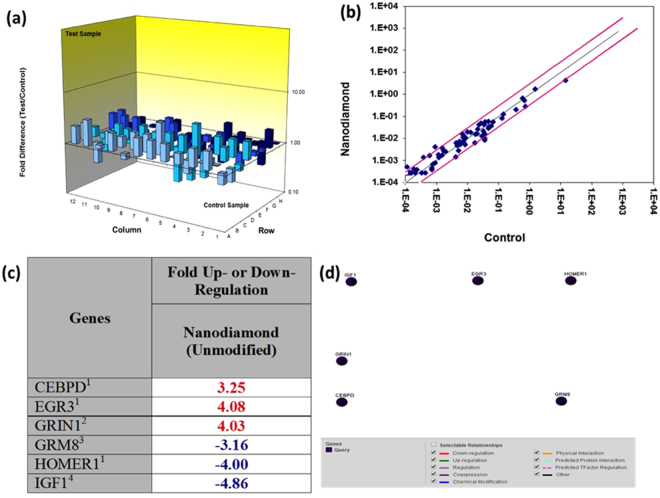
Human synaptic plasticity gene expression in ND-EFV exposed SK-N-MC cells. 84 genes analyzed that is related to the synaptic plasticity of the neurons through PCR array analysis. The only genes that significantly up (in red) /down (in blue) regulated (± ≥3 fold) are shown on the table. (a) 3D-profile of fold change of synaptic plasticity genes in ND exposed SK-N-MC cells. (b) Representative figures for scatter plot analysis of the changes in synaptic plasticity gene expression in ND-EFV exposed SK-N-MC cells: Spots associated with individual human synaptic plasticity gene were collected and converted into log10 scale. The central line indicates unchanged gene expression. The synaptic plasticity genes with expression levels higher or lower in treated neuronal cells than control cells are expected to produce dots that deviate from the centerline. The dots are allocated to positions that are above or below than the +3 fold or 3-fold line when the differences are greater than three folds. (c) Human synaptic plasticity genes expression in ND-EFV exposed SK-N-MC cells (fold change): Out of 84 genes analyzed, only genes significantly (± ≥ 3 fold) dysregulated were shown in this table (d) Gene-Gene interaction network for human synaptic plasticity genes dysregulated in ND-EFV exposed SK-N-MC cells.

