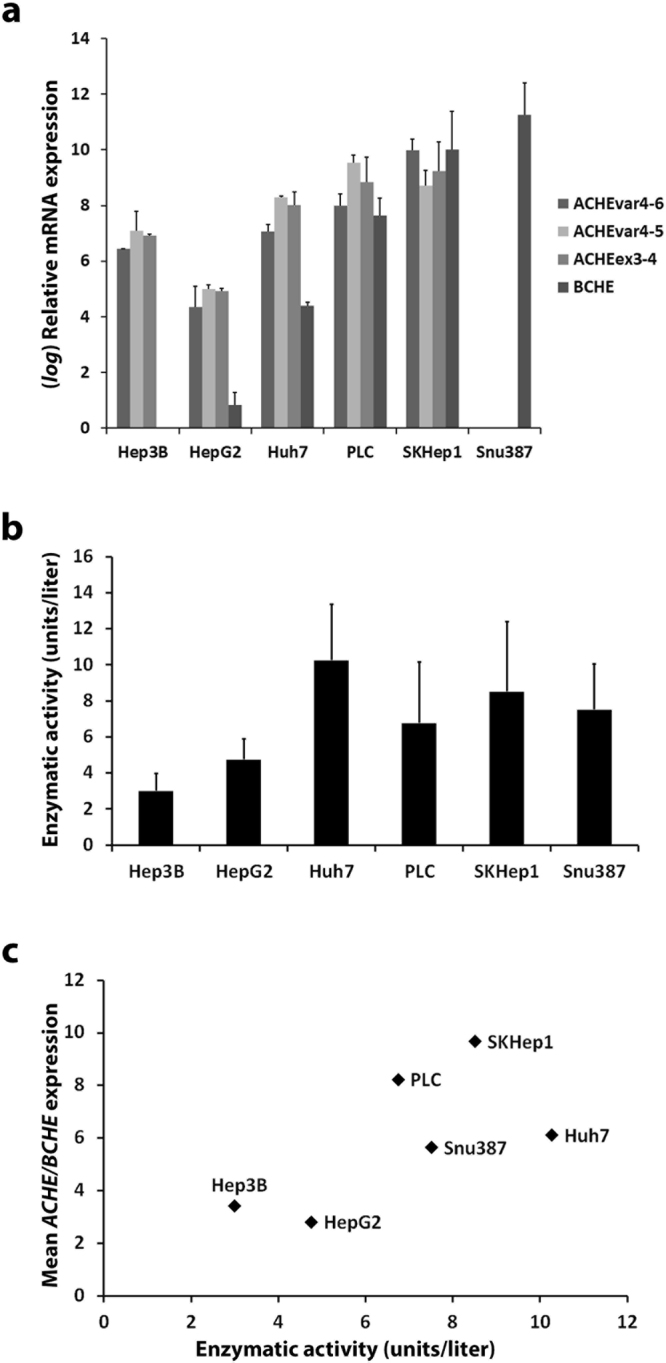
Figure 2.

ACHE, BCHE expression and enzymatic activity profiling in selected liver cancer cell lines. (a) Human ACHE transcript variants ACHE4-6, ACHE4-5 expression and another set of primers targeting ACHE exons no. 3 and 4 (ACHEex3-4) present in both variants were used for measuring relative ACHE expression by qPCR in the cell lines. Additionally, BCHE expression was measured by qPCR. Relative quantification was performed with respect to the cell lines with the lowest expression and log fold change represented. TPT1 gene was taken as reference and ∆∆Ct method formula was used. (b) AChE enzymatic activity in HCC cell lines was measured using an Ellman method based commercial kit. (c) Mean ACHE/BCHE expression values and enzymatic activities were plotted for observation of correlation. Enzymatic activity numerical values were normalized by division to the highest value. All error bars represent the standard deviation.
