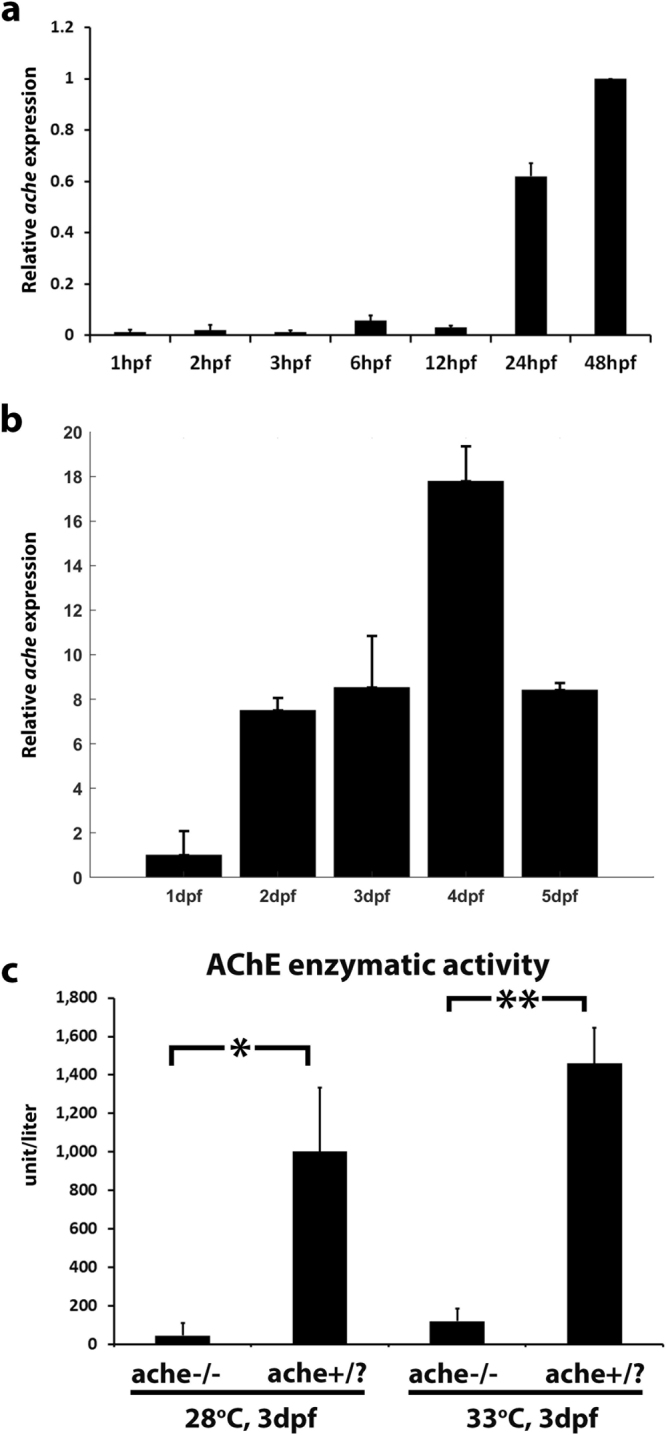
Figure 3.

Temporal gene expression of zebrafish ache during embryonic and larval development. (a) Relative ache expression was quantified by qPCR at selected embryonic stages in AB line (N = 1 experiment, n = 20 embryos per group, standard deviation comes from technical replicates). qPCR reactions were run in duplicates and ∆∆Ct was calculated relative to 48 hpf values and normalized with actb2 expression (b) Relative ache expression was quantified by qPCR at 1–5 dpf (N = 2 experiments, n = 20 embryo/larvae per group). qPCR reactions were run in duplicates and ∆∆Ct was calculated relative to 24 hpf values and normalized with actb2 expression. (c) Normalized O.D. 412 values for groups of embryos. AChE enzymatic activity was almost absent in tail-test selected ache−/− mutant embryos when compared with wild-type ache+/? siblings at 28 °C (P = 0.034) or at 33°C (P = 0.003) (performed in triplicates, n = 8 embryos per group). Error bars show the standard deviation.
