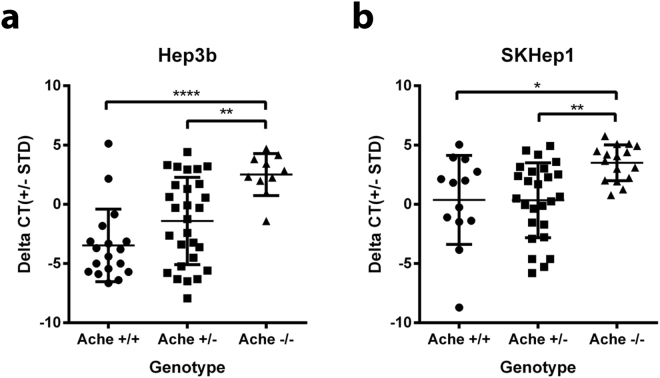
Figure 7.
The comparison of the AluYb8 Ct values between genotypes using a qPCR assay. DNA was extracted from 3 dpi larvae injected with liver cancer cell lines (Hep3B and SKHep1) were amplified by qPCRs with using ache N, ache S, and AluYb8 primers (Supplementary Table 1). The Ct value difference (∆Ct) between ache N and ache S primers were used for the genotyping (Supplementary Figure 8). (a) For Hep3B (n = 18, 28 and 10 for ache+/+, ache+/− and ache−/−) normalized Ct values were significantly higher in ache−/− larvae in comparison to both ache+/− and ache+/+ larvae (P = 0.005 and 0.0001, respectively). (b) For SKHep1 (n = 13, 26 and 16 for ache+/+, ache+/− and ache−/−) normalized Ct values were significantly higher in ache−/− larvae in comparison to both ache+/− and ache+/+ (P = 0.004 and 0.017, respectively).

