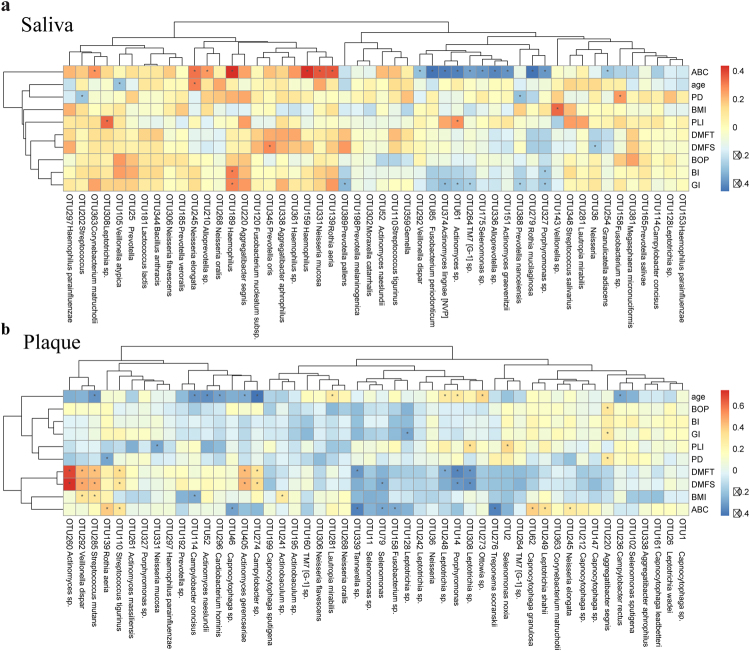
Figure 5.
Correlation between OTUs and various clinical indices. The abundance of OTUs (top 50) enriched in saliva (a) and dental plaques (b) of ASD children and controls were analyzed for covariation with clinical variables using Spearman’s rank correlation. The correlation effect is indicated by a color gradient from blue (negative correlation) to red (positive correlation). Correlation coefficients and p-values (*p < 0.05) are shown. OTUs and clinical variables in the heat maps were ordered using unsupervised hierarchical clustering. BMI, Body Mass Index; DMFT, Decayed-Missing-Filled Teeth; DMFS, Decayed-Missing-Filled Surface; PLI, Plaque Index; GI, Gingival Index; BI, Bleeding Index; PD, Probing Depth; BOP, Bleeding on Probing; ABC score, scale of ASD severity.

