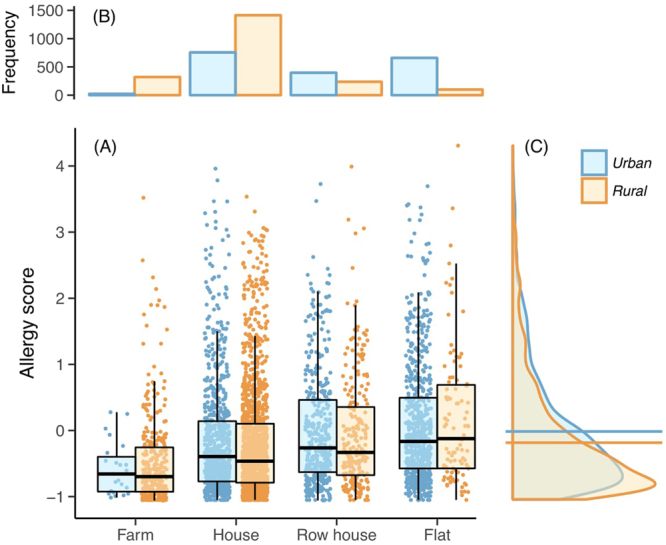
Figure 2.

Housing type in relation to allergy score in allergy-tolerant breeds. (A) The type of living apartment was associated with the allergy score (P < 0.0001, based on generalized least squares, assuming group-specific residual variance). While the pattern was repeated for both urban (blue) and rural (orange) environments (and overall the allergy score was higher in urban environments as shown in (C); P = 1.3e−9), the type of the apartment was also related to the living environment—this is shown in panel (B) (χ2 = 901.4, P < 2.2e−16), and thus the effect of these is hard to separate. (B) The frequency of different housing types across urban and rural environments. (C) The distribution of allergy score in urban and rural individuals, across all housing types. Horizontal lines indicate mean values for each distribution showing that the mean allergy score is higher in urban than in rural individuals. In Fig. 2B,C the redundant axes have been omitted.
