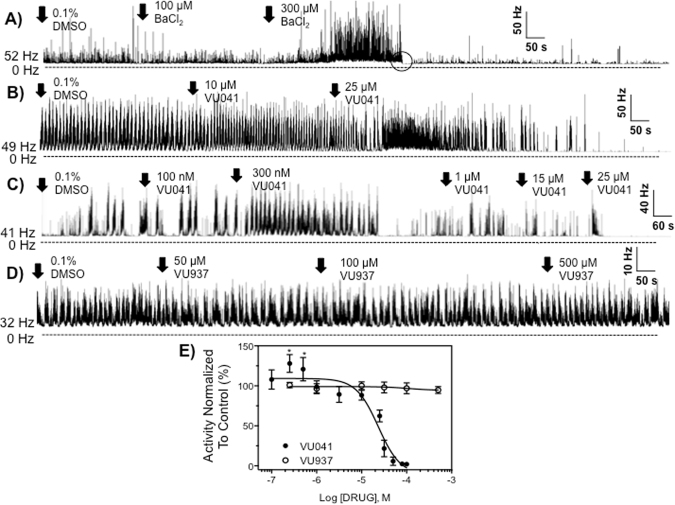
Figure 3.
Neurophysiological recordings from the CNS of third instar larvae of D. melanogasgter after exposure to pharmacological modulators of Kir channels. Representative nerve discharge traces before and after exposure to (A) BaCl2, (B) high concentrations of VU041, (C) low concentrations of VU041, and (D) the inactive analog termed VU937. Initial spike discharge frequencies in spikes/second (Hz) for each experiment are given to the left of each trace. (E) Concentration-response curves for VU041 and VU937 on CNS nerve discharge of D. melanogaster larvae from replicated recordings (n = 3–5 concentration per curve, with each concentration replicated at least 5 times). Data points represent mean percentage increase of baseline spike discharge frequency, and error bars represent SEM of drug concentrations replicated at least 5 times. When error bars are absent, it is because they are smaller than the size of the symbol. Asterisks represent statistical significance with *representing P < 0.05 as determined by an unpaired t-test to the average baseline spike discharge frequency.

