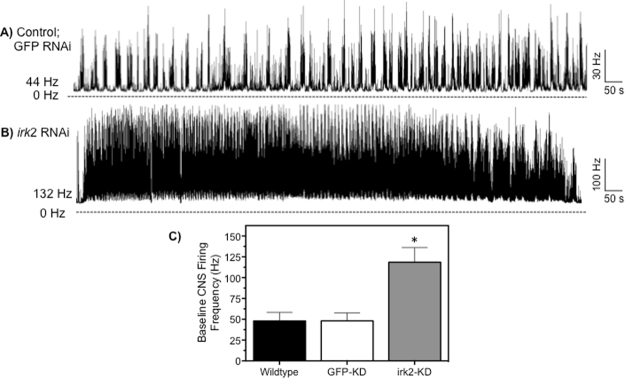
Figure 5.
Neurophysiological recordings from the CNS of third instar larvae of D. melanogaster after CNS specific knockdown of irk2. Representative nerve discharge traces of knockdown control (GFP) flies (A) and the irk2 knockdown strain (B). Initial spike discharge frequencies in spikes/second (Hz) for each experiment are given to the left of each trace. (C) Average baseline spike discharge frequency (Hz) of the wildtype (OR) flies, GFP-knockdown (control), and irk2 knockdown flies. Bars represent mean (n = 25) spike discharge frequency and error bars represent SEM. *Denotes statistical significance at P < 0.01 as determined by a multiple comparisons test.

