Figure 2.
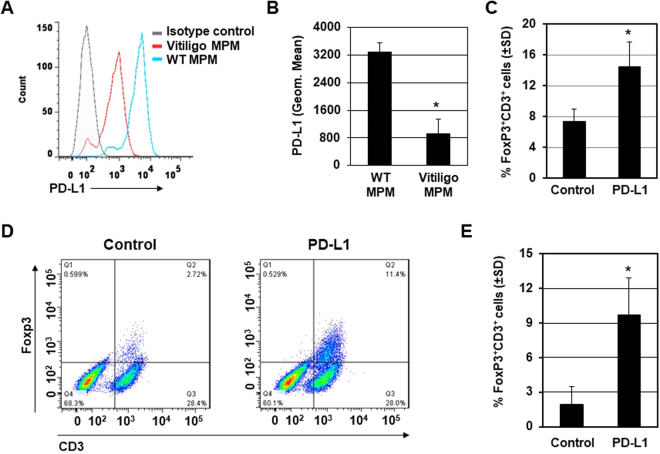
PD-L1 fusion protein treatment regulates T cell enrichment. (A) MPM were isolated from Pmel-1 mice. PD-L1 were detected by flow cytometry with specific anti-PD-L1 antibody. (B) Quantification of PD-L1 expression in MPM from (A). *p < 0.05. (C) Expression of FoxP3 and CD3 was evaluated by immunofluorescence staining with specific anti-FoxP3 and anti-CD3 antibodies and then quantified. (D) Splenocytes were isolated and assayed for Treg cell population by flow cytometry. Representative flow cytometry images of FoxP3+CD3+ cell population were showed (Control group n = 6 cases, PD-L1 fusion protein treated group n = 6 cases). (E) Quantification of Treg cells population from (C) were shown. *p < 0.05.

