Fig. 5.
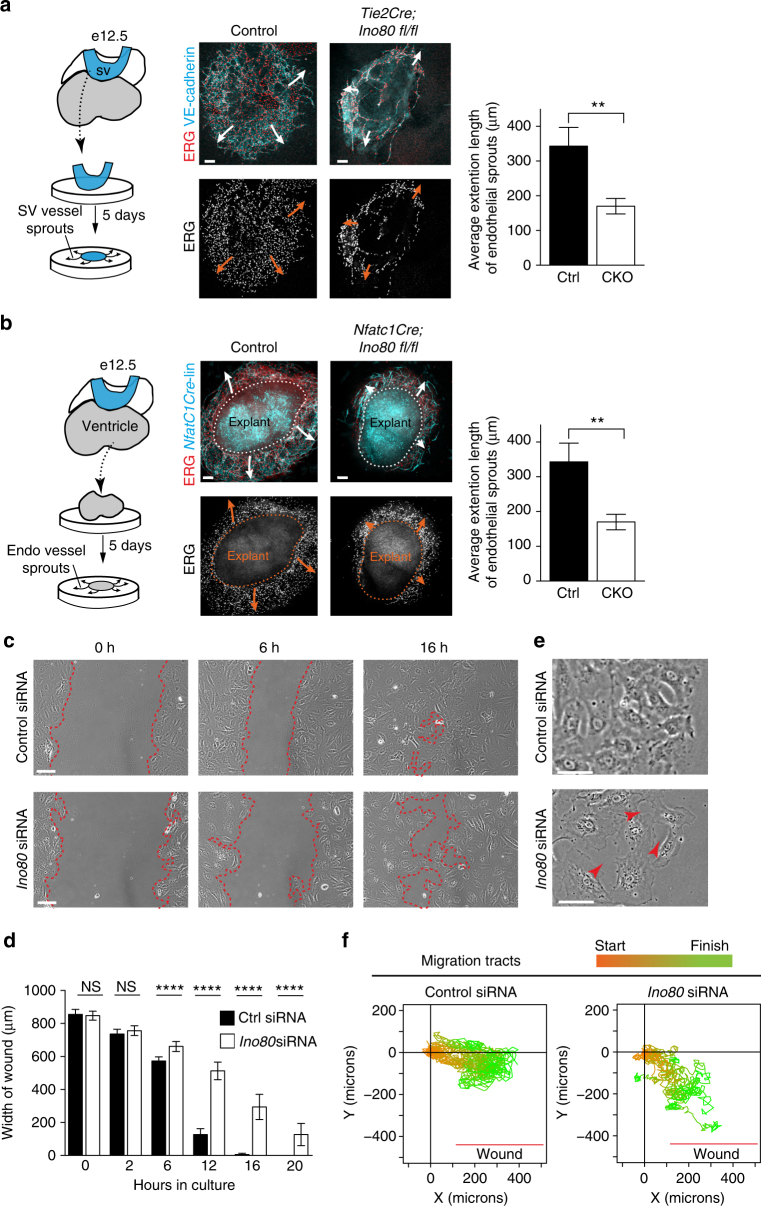
Ino80 depletion results in faulty endothelial cell sprouting and migration. a, b Schematics, confocal images, and quantifications of sinus venosus and endocardial angiogenesis assays. Arrows indicate direction of endothelial cell sprouting. Endothelial cells are labeled with ERG and either VE-cadherin (a) or through Nfatc1Cre lineage tracing (Nfatc1Cre-line) (b). Images are representative of the following number of replicates: sinus venosus (control, n = 5 heart explants; mutant, n = 3 heart explants) (a) and ventricles (Ino80 deleted using Nfatc1Cre), (control, n = 8 heart explants; mutant, n = 3 heart explants). Scale bars: 100 μm. Sprouting of endothelial cells is significantly decreased in Ino80-deficient explants from both the sinus venosus (Ino80 deleted using Tie2Cre), (control, n = 5 heart explants; mutant, n = 3 heart explants) (a) and ventricles (Ino80 deleted using Nfatc1Cre), (control, n = 8 heart explants; mutant, n = 3 heart explants) (b). (**) P < 0.01, evaluated by Student’s t-test. c–f In vitro wound assays with control or Ino80-depleted primary Human Umbilical Vein Endothelial Cells (HUVECs). c Migration to fill the wound is slower and less collective in Ino80-depleted cells. Images are representative of the following number of replicates: Control, n = 6; Ino80 siRNA, n = 6. Scale bars: 100 μm. d Quantification of wound closure. Error bars in graphs are standard deviation. (Control, n = 6; Ino80 siRNA, n = 6). NS nonsignificant, ****P < 0.0001, evaluated by Student’s t-test. e Representative higher magnification highlights the abnormal space (arrowheads) between mutant cells at the migration front. Scale bars: 50 μm. (Control, n = 6; Ino80 siRNA, n = 6). f Migration tracts (n = 20 cells/condition) color-coded to highlight starting (orange) and ending (green) points show the decreased directionality of mutant cells. Error bars in graphs are standard deviation

