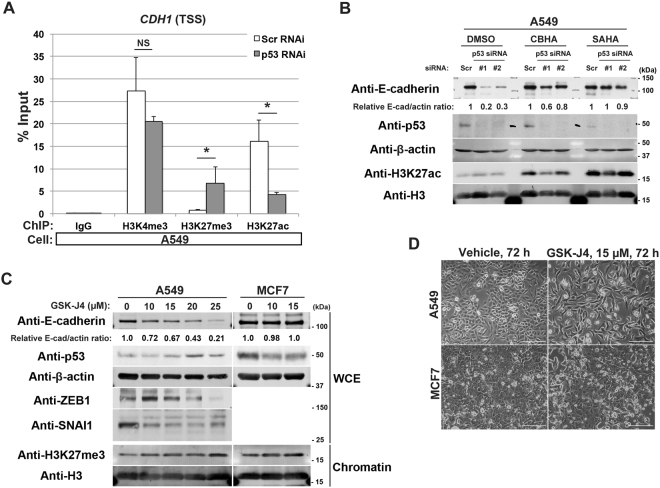
Figure 2.
Loss of p53 leads to epigenetic alterations around the CDH1 TSS in A549 cells. (A) A549 cells transfected either with the scramble (Scr RNAi) or p53 (p53 RNAi) siRNA were subjected to ChIP using antibodies against the indicated modified histones, followed by quantitative RT-PCR analysis with the primers located near the TSS of the CDH1 locus. Data are means ± SD of 3 independent experiments. *P < 0.05; NS, not significant vs Scr RNAi (Student t-test). (B) A549 cells transfected with scramble (Scr) or p53 (#1 or #2) siRNA were then treated with 2.5 µM of CBHA or 3.0 µM of SAHA for 30 h. Whole cell extracts were then subjected to immunoblot analysis with the indicated antibodies. E-cadherin and β-actin bands (E-cad and actin, respectively) were quantified using Image J software, and normalized E-cad/actin ratios are indicated. (C) A549 cells and MCF7 cells were treated with the indicated concentrations of GSK-J4 for 72 h. Whole cell extracts (WCE) or 1.5 µg of chromatin fractions (Chromatin) were subjected to immunoblot analysis with the indicated antibodies. Quantitative western blots of E-cadherin and β-actin (E-cad and actin, respectively) were performed with the infrared fluorescence imaging system on an Odyssey imager, and normalized E-cad/actin ratios are indicated. (D) Phase contrast images of A549 cells or MCF7 cells treated with 15 µM of GSK-J4 for 72 h. Bars, 200 µm. Western blots were cropped for clarity; uncropped images are shown in Supplementary Figure S5.

