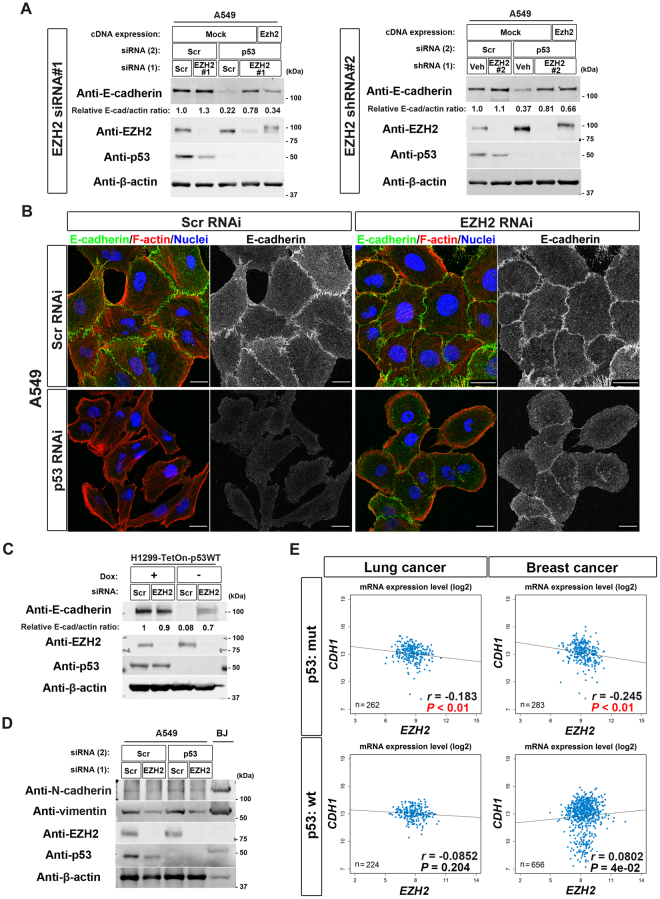
Figure 3.
EZH2 mediates loss-of-p53-induced E-cadherin suppression in EMT-prone cells. (A) A549 cells reverse-transfected either with scramble (Scr) or EZH2 (EZH2 #1) siRNA (left) or transduced with lentiviruses expressing either vehicle (Veh) or shEZH2 (EZH2 #2) (right) were then transfected with scramble (Scr) or p53 siRNA (p53). The cells were then replated and reverse-transfected with mock or FLAG-HA-tagged mouse Ezh2 cDNA (Ezh2). After culturing for 72 h, the cells were subjected to immunoblot analysis with the indicated antibodies. Quantitative western blots of E-cadherin and β-actin were performed with the infrared fluorescence imaging system on an Odyssey imager. The normalized E-cadherin/β-actin (E-cad/actin) ratios are indicated. (B) A549 cells treated as in (A) were cultured for 72 h before fixation. The cells were stained with Texas Red–phalloidin (red) to detect F-actin, with antibodies to E-cadherin (green), and with DAPI (blue) to visualize nuclei. Bars, 20 µm. (C) H1299-TetOn-p53WT cells transfected with scramble (Scr) or EZH2 siRNA were cultured in the presence (+) or absence (−) of doxycycline (Dox) (0.5 µg/ml) for 48 h. The cells were then subjected to immunoblot analysis with the indicated antibodies. E-cadherin and β-actin bands (E-cad and actin, respectively) were quantified using Image J software, and normalized E-cad/actin ratios are indicated. (D) A549 cells treated as in (A) and BJ fibroblast cells were subjected to immunoblot analysis with the indicated antibodies. (E) Dot plots of TCGA RNA expression profiles of CDH1 and EZH2 in lung cancer or breast cancer with wild-type (wt) p53 or mutant (mut) p53 are shown. The Spearman rank correlation test was performed to analyse the statistical significance. A P-value of less than 0.05 for the inverse correlation is shown in red. Western blots were cropped for clarity; uncropped images are shown in Supplementary Figure S5.

