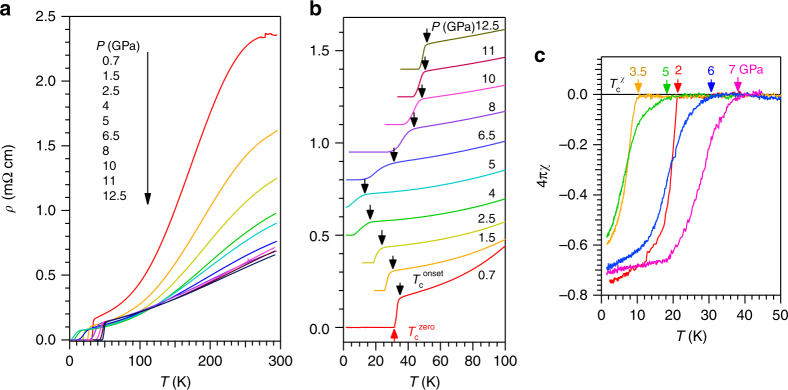
Fig. 1.
High-pressure resistivity and AC magnetic susceptibility for (Li1−xFex)OHFe1−ySe. a ρ(T) curves in the whole temperature range illustrating the overall behaviors under pressure up to 12.5 GPa. b ρ(T) curves below 100 K illustrating the variation with pressure of the superconducting transition temperatures. Except for data at 0.7 GPa, all other curves in b have been vertically shifted for clarity. The onset Tconset (down-pointing arrow) was determined as the temperature where resistivity starts to deviate from the extrapolated normal-state behavior, while the Tczero (up-pointing arrow) was determined as the zero-resistivity temperature. c 4πχ(T) curves measured under different pressures up to 7 GPa. The superconducting diamagnetic signal appears below Tcχ

