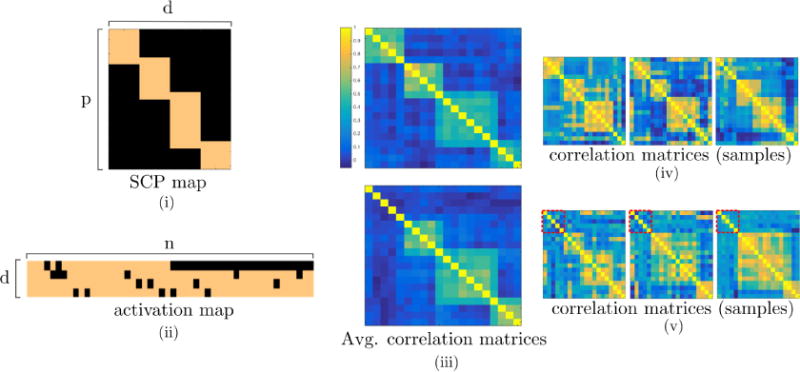
Fig. 2.

An illustrative view of one of the simulated datasets generated using SimTB toolbox. (i) SCP map for a given run. (ii) Population-wise activation map representing heterogeneity across subjects. Looking at the first row, notice that SCP 1 is assigned a weight of zero for the second class (second half of the subjects). (iii) Subject-average correlation matrices for first (top) and second (bottom) classes. (iv–v) Randomly selected subject’s correlation matrices. Dashed red squares indicate pairwise correlation between nodes belonging to the first SCP, i.e. the one consistently missing in the second class.
