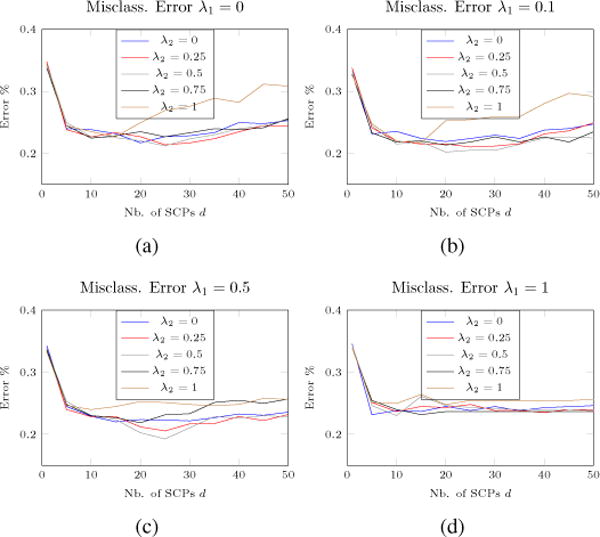
Fig. 4.

Classification error on 10-fold for various parameter values. While an initial sharp decrease in classification error can be observed with an increase of d, the error rates then reaches a plateau for the approximate range d ∈ [20, 30]. It can then be seen that a higher number of SCPs leads to a moderate increase of classification error. As a consequence, for our tests, we used (λ1, λ2, d) = (0.5,0.5,25).
