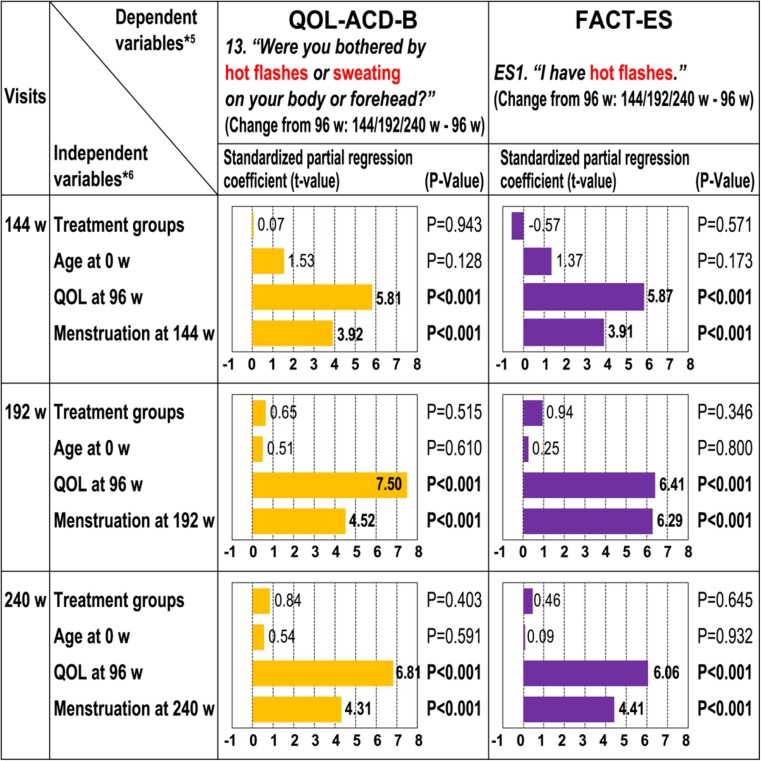
Fig. 4.
Multiple regression analyses for factor–quality of life (QOL) change relationship. Higher values mean better QOL [ES1 scale is inverted according to the QOL Questionnaire for Cancer Patients Treated with Anticancer Drugs-Breast (QOL-ACD-B) score]. Treatment groups (1 = 2 years; 0 = 3 or more years). Age at week 0 multiplied by (− 1). QOL at week 96: QOL-ACD-B (item 13) or Functional Assessment of Cancer Therapy-Endocrine Symptoms (FACT-ES) (ES1) at week 96 multiplied by (−1). Menstruation (1, yes; 0, no). 144 w week 144, 192 w week 192, 240 w week 240

