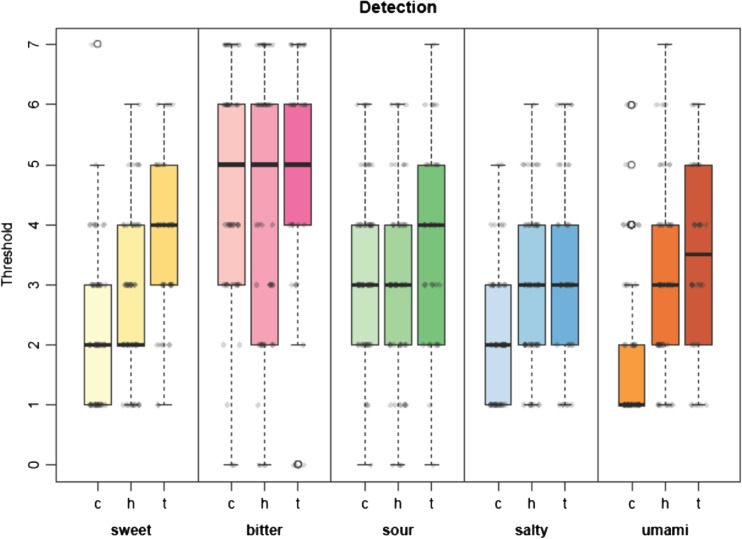
Fig. 1.
Detection threshold—comparison of the three groups. c control group, h hospitalized group, t tumor group. p values (Kruskal-Wallis rank sum test): p kw. p values (adjusted by Holm-Bonferroni): p ch = control group vs. hospitalized group, p ct = control group vs. tumor group, p ht = hospitalized group vs. tumor group. 1. Sweet: p kw = 0.00151. c vs. h, c vs. t, h vs. t. p values: p ch = 0.985, p ct = 0.004, p ht = 0.004. Numbers of subjects taken into account / n value: n c = 63, n h = 57, n t = 38. 2. Bitter: p kw = 0.492. c vs. h, c vs. t, h vs. t. p values: p ch = 0.846, p ct = 0.846, p ht = 0.846. Numbers of subjects taken into account / n value: n c = 63, n h = 57, n t = 38. 3. Sour: p kw = 0.0249. c vs. h, c vs. t, h vs. t. p values: p ch = 0.103, p ct = 0.507, p ht = 0.039. Numbers of subjects taken into account / n value: n c = 63, n h = 57, n t = 38. 4. Salty: p kw = 0.02. c vs. h, c vs. t, h vs. t. p values: p ch = 0.098, p ct = 0.021, p ht = 0.243. Numbers of subjects taken into account / n value: n c = 63, n h = 57, n t = 38. 5. Umami: p kw = 0.000216. c vs. h, c vs. t, h vs. t. p values: p ch = 0.002, p ct < 0.001, p ht = 0.150. Numbers of subjects taken into account / n value: n c = 63, n h = 56, n t = 38

