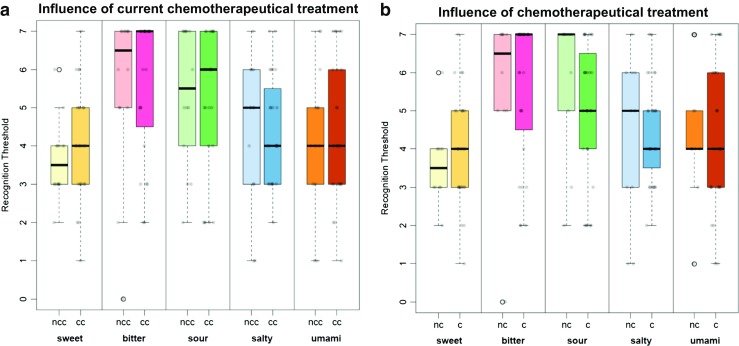
Fig. 4.

Recognition thresholds. (a) Influence of current chemotherapeutical treatment. Recognition threshold of patients receiving current chemotherapy vs. patients currently not receiving chemotherapy. cc current chemotherapy, ncc no current chemotherapy. n value: n cc = 24, n ncc = 14. Wilcoxon-Mann-Whitney test: Significance levels: 1. Sweet: p cc/ncc = 0.266, W = 131,5. 2. Bitter: p cc/ncc = 0.958, W = 166. 3. Sour: p cc/ncc = 0.661, W = 182.5. 4. Salty: p cc/ncc = 0.687, W = 181.5. 5. Umami: p cc/ncc = 0.922, W = 164.5. (b) Influence of chemotherapeutical treatment. Recognition threshold of chemotherpeutically treated patients vs. chemotherapy-naïve patients. c chemotherapy, nc no chemotherapy (chemotherapy-naïve). n value: n c = 28, n nc = 10. Wilcoxon-Mann-Whitney test: Significance levels: 1. Sweet: p c/nc = 0.31, W = 109.5. 2. Bitter: p c/nc = 1, W = 139.5. 3. Sour: p c/nc = 0.126, W = 185. 4. Salty: p c/nc = 0.895, W = 144. 5. Umami: p c/nc = 0.786, W = 148.5
