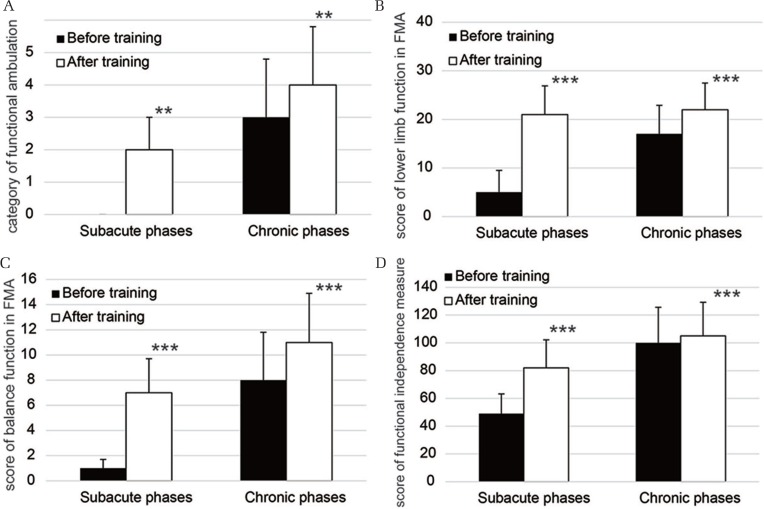
Fig. 1.
Change in functional assessments of the patients in the subacute-phase disease group and chronic-phase disease group. The bar graphs show the median scores for the functional ambulation category before HAL training and after HAL training (A). The bar graphs illustrate the median scores for lower extremity function in the Fugl-Meyer assessment (FMA) (B). The bar graphs demonstrate the median scores for balance in the FMA (C). The bar graphs show the median scores of functional independent measure (D). ** and *** denote P < 0.01 and P < 0.001, respectively (the Wilcoxon rank-sum test).

