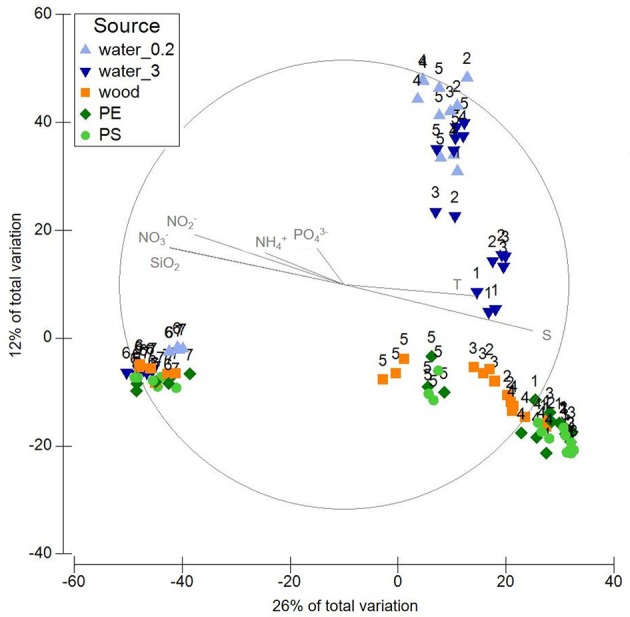
Figure 2.

PCO displaying variation in microbial community composition in the different sample sources water (free-living fraction=water_0.2; particle-attached fraction=water_3), wood, PE, PS. Labels refer to sampling stations 1-7. Plot is based on a Bray-Curtis similarity matrix of square root transformed relative abundances of OTUs (16S rRNA gene data).
