Figure 5.

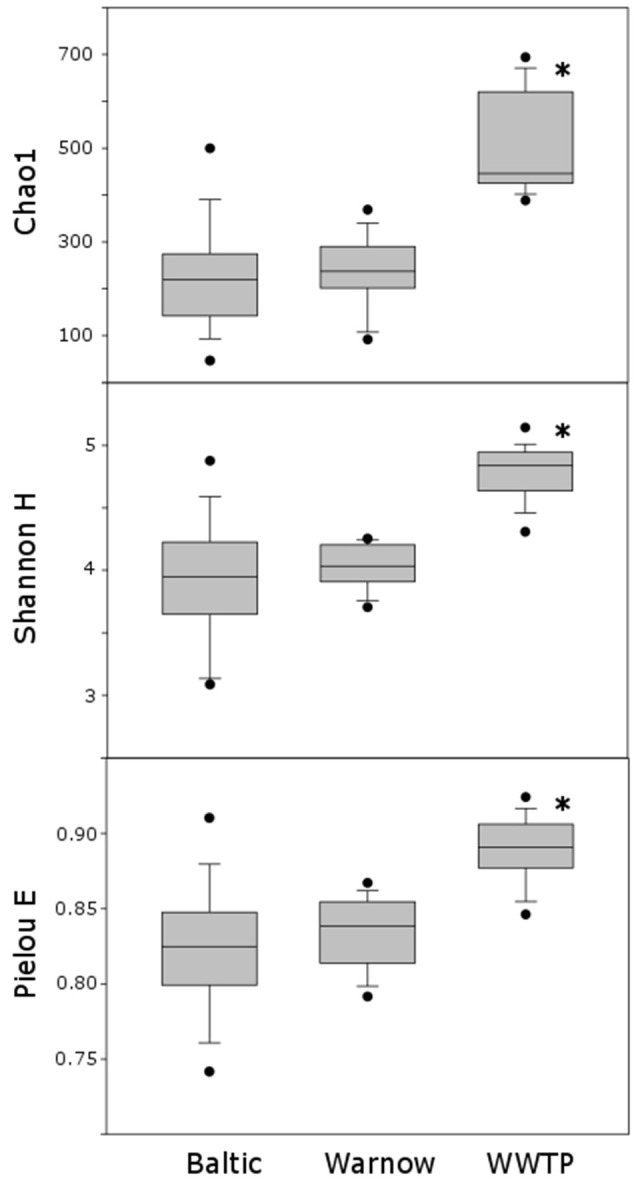
Box plots illustrating the Chao1, Shannon H and Pielou E indices of datasets “Baltic,” “Warnow,” “WWTP”; *indicates significant differences (p < 0.01) between datasets.

Box plots illustrating the Chao1, Shannon H and Pielou E indices of datasets “Baltic,” “Warnow,” “WWTP”; *indicates significant differences (p < 0.01) between datasets.