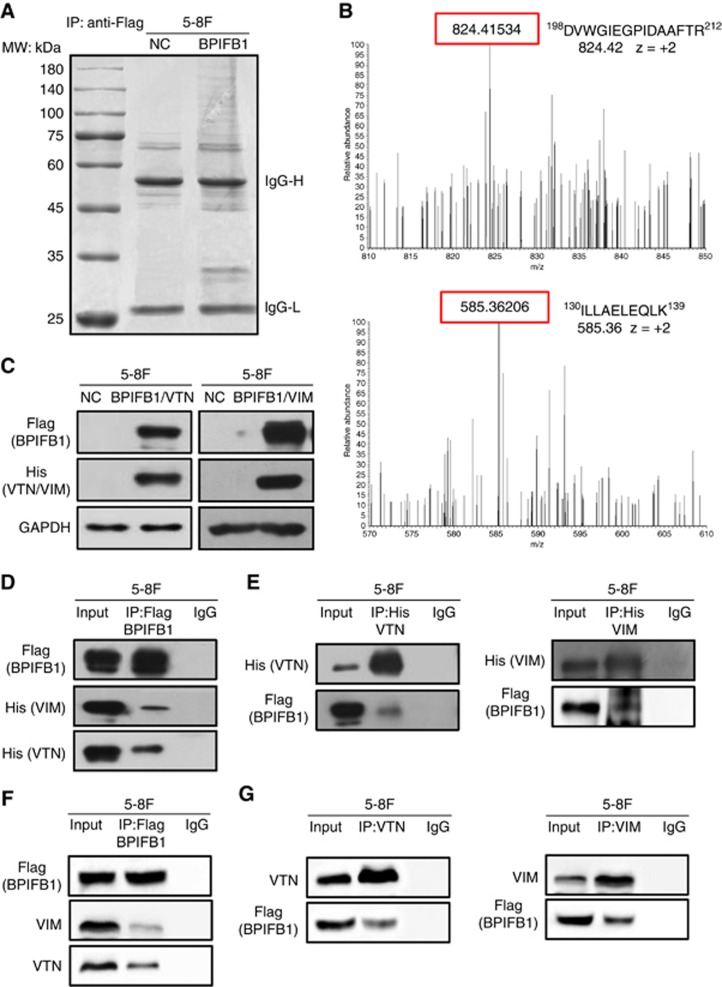
Figure 3.
Identification of BPIFB1-interacting proteins via IP-MS. (A) Co-IP was performed in 5-8F cells transfected with the BPIFB1-Flag plasmid using an anti-Flag antibody. The precipitated complex was subjected to SDS–PAGE and Coomassie blue staining. IgG heavy chain (IgG-H) and light chain (IgG-L) are 55 and 25 kDa, respectively. The molecular weight (MW) marker is shown on the left. (B) Representative image and charge states are shown according to the corresponding MS/MS spectrum. LC-MS/MS spectra of precursor ions at m/z 824.42 correspond to VTN residues 198 through 212 (DVWGIEGPIDAAFTR), and m/z 585.36 corresponds to VIM residues 130 through 139 (ILLAELEQLK). (C) BPIFB1 and VTN (or VIM) expression was examined at the protein level by western blot using 5-8F cells co-transfected with BPIFB1-Flag and His-VTN (or -VIM) vectors. (D and E) Co-IP was performed to detect interactions between BPIFB1 and exogenous VTN (or VIM) in 5-8F cells co-transfected with BPIFB1-Flag and His-VTN (or -VIM) using anti-Flag (BPIFB1) and anti-His (VTN or VIM) antibodies. (F and G) Co-IP was performed to detect interactions between BPIFB1 and endogenous VTN (or VIM) in 5-8F cells transfected with only BPIFB1-Flag vector using anti-Flag (BPIFB1) and anti-VTN or VIM antibodies.

