Figure 4.
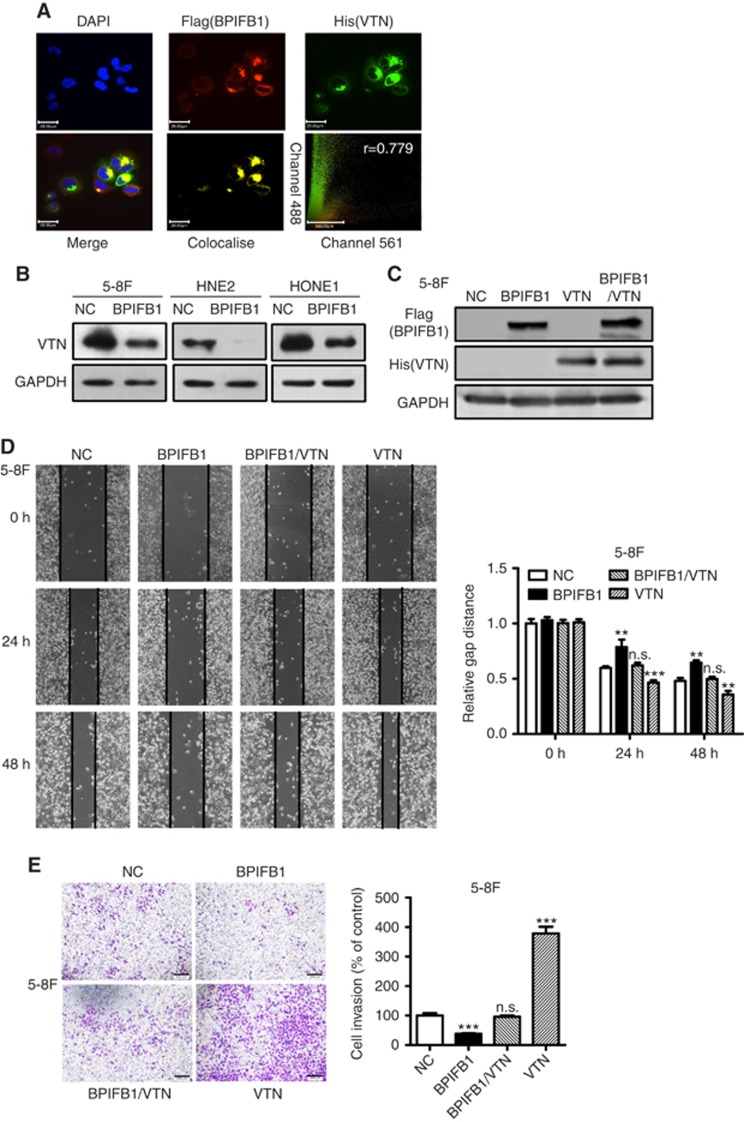
BPIFB1 inhibits NPC-cell migration and invasion by downregulating VTN expression. (A) BPIFB1 and VTN colocalisation in 5-8F cells. DAPI-stained nuclei: blue; anti-Flag-BPIFB1: red; anti-His-VTN: green; merged image represents the overlay of DAPI, Flag, and His signals; BPIFB1 and VTN colocalisation: yellow. Scatter analysis shows the signals of Channel 561 (BPIFB1) and 488 (VTN). Pearson’s correlation coefficient of colocalisation is indicated in the top right corner of the plot. Scale bar=29 μm. (B) BPIFB1 downregulates VTN expression in 5-8F, HNE2, and HONE1 cells transfected with the BPIFB1-Flag overexpression vector as compared with the control group. (C) BPIFB1 and VTN protein expression was confirmed by western blot in 5-8F cells transfected or co-transfected with BPIFB1-Flag and VTN-His vectors using anti-Flag and anti-His primary antibodies. (D and E) Representative images of migration and transwell Matrigel invasion assays on 5-8F cells transfected or co-transfected with BPIFB1-Flag and VTN-His vectors. The graph summarises the data from three independent experiments. **P<0.01; ***P<0.001; n.s., no significance. Scale bars=200 μm.

