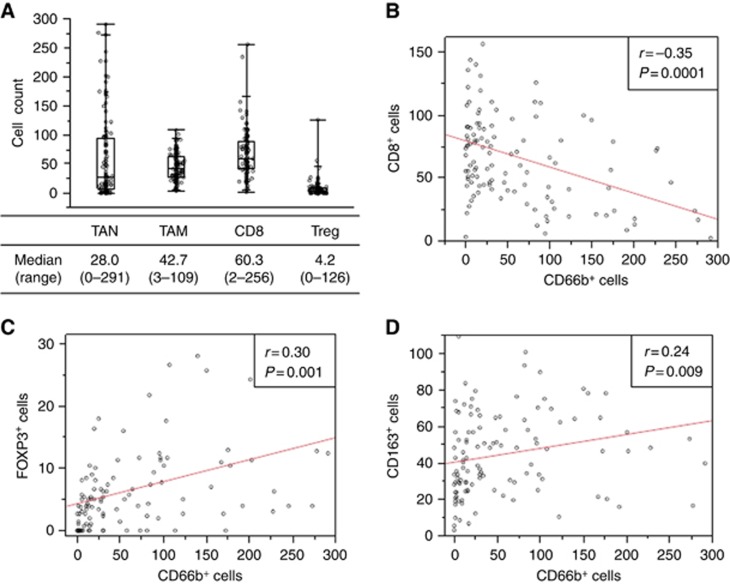
Figure 2.
Distribution and relationships of tumour-infiltrating immune cells. (A) Distributions of tumour-infiltrating CD66b+, CD163+, CD8+ and FOXP3+ cells are shown in box plots. (B–D) The relationships of (B) CD66b+ and CD8+, (C) CD66b+ and FOXP3+, (D) CD66b+ and CD163+ expression are shown. One circle corresponds to one patient. TAM = tumour associated macrophage; TAN = tumour associated neutrophil; Treg = regulatory T cells.

