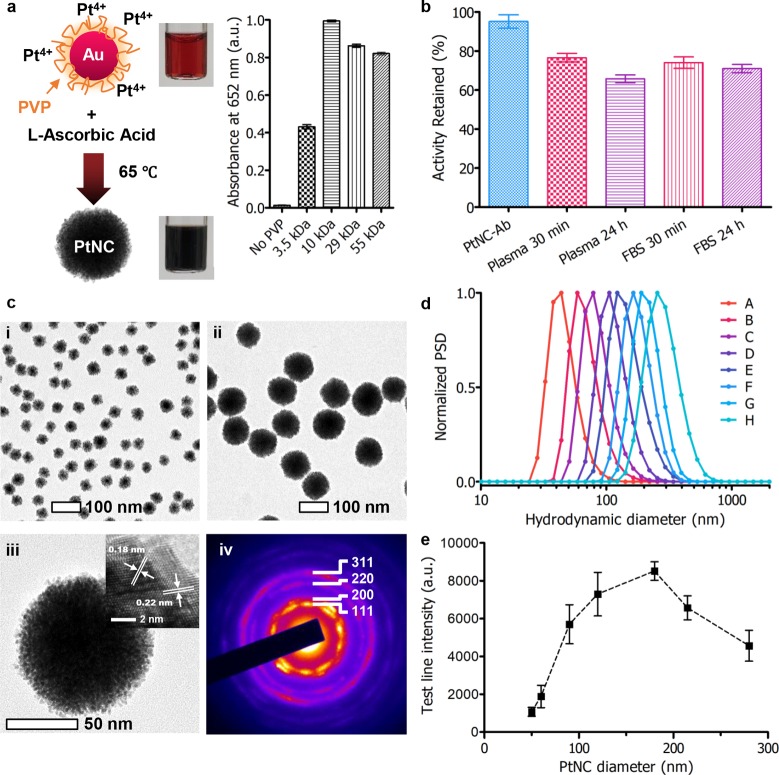
Figure 2.
(a) Scheme showing synthesis of Au–Pt core–shell structure (PtNC), where 15 nm gold nanoparticles are used as seeds for subsequent platinum overgrowth in the presence of polyvinylpyrrolidone (PVP) as a stabilizer and l-ascorbic acid as a reducing agent. Influence of PVP molecular weight on PtNC catalytic activity, measured by the absorbance at 652 nm corresponding to the oxidation of TMB by H2O2 (n = 3). In the absence of PVP, significant aggregation occurred. (b) Catalytic activity of PtNCs incubated in serological and protein-rich environments up to 24 h (n = 6). (c) Transmission electron micrographs of PtNCs synthesized with varying AuNP seed concentrations to control size: (i) 5 nM seeds and (ii) 0.3 nM seeds. (iii) High-resolution TEM image of an individual PtNC formed from 0.3 nM seed concentration. Inset shows the lattice fringes corresponding to platinum (111) and (200). (iv) Selected area electron diffraction (SAED) pattern taken from a single PtNC (ca. 120 nm) with diffraction spots consistent with polycrystalline platinum with an FCC lattice. (d) Number distribution of the hydrodynamic diameter of PtNCs formed by varying [Au]:[Pt] measured by dynamic light scattering. Batches were synthesized in the presence of different gold nanoparticle seed concentrations: A, 5 nM; B, 1.2 nM; C, 0.6 nM; D, 0.3 nM; E, 0.15 nM; F, 0.08 nM; G, 75 pM ca. 120 nm PtNCs as seeds; H, 40 pM ca. 120 nm PtNCs as seeds. (e) Intensity of test line for antibody modified PtNCs (150 pM) varying in size from ca. 50 to 280 nm (mean number distribution by DLS) for detection of 100 pg·mL–1 p24 in FBS with 5 min development in CN/DAB and H2O2. All data are averaged from ≥3 independent measurements where error bars represent the standard deviation from the mean.

