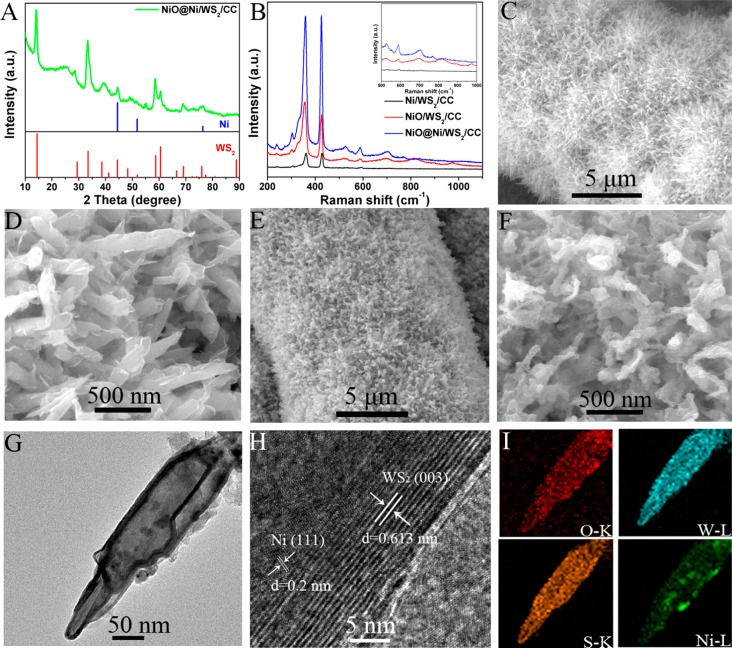
Figure 2.
(A) XRD pattern of NiO@Ni/WS2/CC. (B) Raman spectra of Ni/WS2/CC, NiO/WS2/CC, and NiO@Ni/WS2/CC. SEM images of (C, D) WS2/CC and (E, F) NiO@Ni/WS2/CC. (G) TEM image of one single NiO@Ni/WS2 nanosheet. (H) HRTEM image taken from the NiO@Ni/WS2 nanosheet. (I) EDX elemental mapping images of an individual NiO@Ni/WS2 nanosheet.

