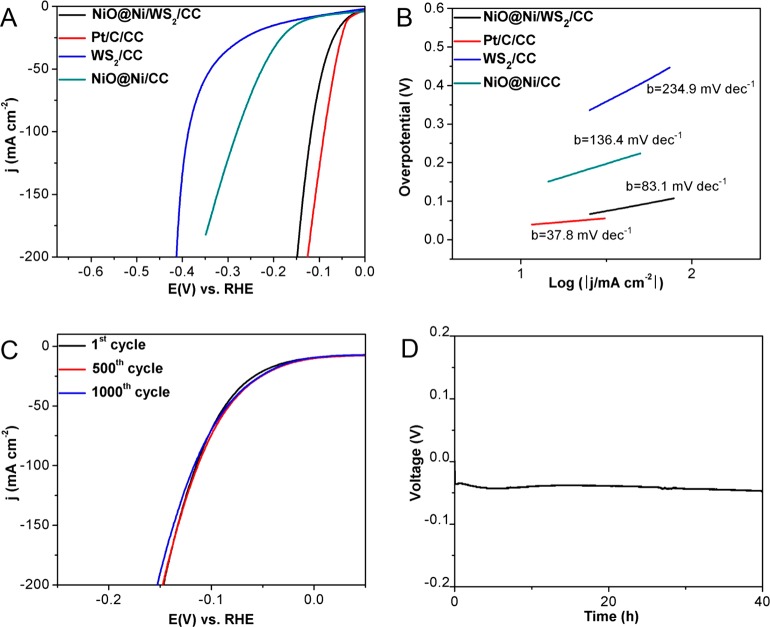
Figure 4.
(A) The LSV curves for NiO@Ni/WS2/CC, WS2/CC, Pt/C/CC, and NiO@Ni/CC with a scan rate of 5 mV s–1 for HER. (B) The corresponding Tafel plots. (C) LSV curves for NiO@Ni/WS2/CC initially, after 500 and 1000 CV cycles. (D) Potentiostatic electrolysis of NiO@Ni/WS2/CC for 40 h with a scan rate of 5 mV s–1.

