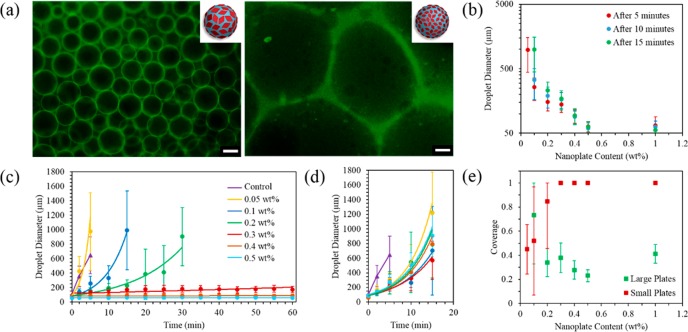
Figure 3.
(a) Fluorescence microscopy image of emulsion droplets prepared with large (left) and small (right) diamond platelets after 60 min at 0.5 wt % using 0.01 wt % fluorescein-labeled dextran, where the green color indicates the dextran-rich phase. Scale bar = 200 μm. (b) Plot showing the decrease in emulsion droplet diameter with increasing concentration using large diamond platelets at 5, 10, and 15 min. Emulsion droplet diameter using (c) large diamond platelets (prepared with 12% THF) and (d) small diamond platelets (prepared with 0% THF) as a function of time. (e) Effect of small and large platelets on particle coverage of the droplets. Error bars indicate the standard deviation in droplet diameter when counting ca. 100 droplets.

