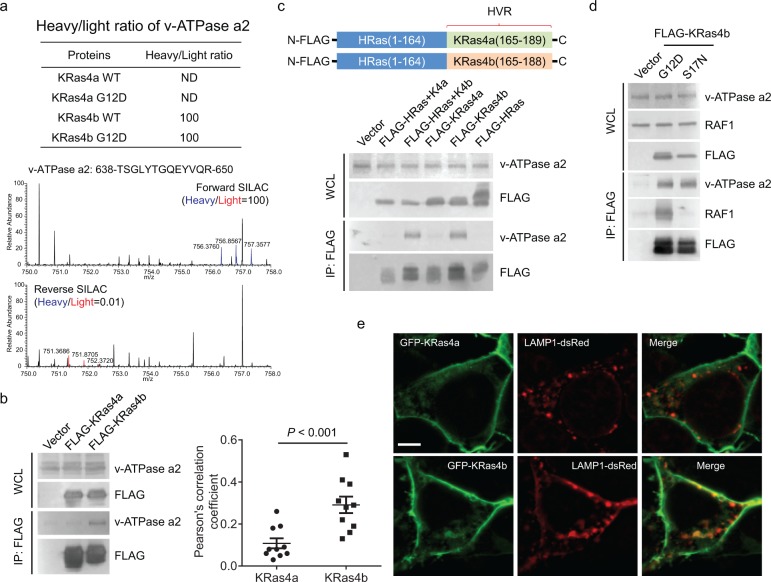
Figure 2.
KRas4b interacts with v-ATPase a2 through its C-terminal HVR. (a) Heavy/light ratio of v-ATPase a2 in KRas4a/b SILAC and the primary mass spectra of one v-ATPase a2 peptide (residues 638–650) in forward and reverse KRas4b SILAC. (b) Immunoprecipitation of FLAG-tagged KRas4b, but not KRas4a, pulled out endogenous v-ATPase a2 in HEK293T cells. (c) Immunoprecipitation of FLAG-tagged HRas(1–164)-KRas4b (165–188) (labeled as FLAG-HRas+K4b), but not FLAG-tagged HRas(1–164)-KRas4a (165–189) (labeled FLAG-HRas+K4a), pulled out endogenous v-ATPase a2 as FLAG-tagged KRas4b did. (d) Immunoprecipitation of both FLAG-tagged KRas4b G12D and S17N pulled out similar levels of endogenous v-ATPase a2. RAF1 was used as a positive control, which only interacted with KRas4b G12D but not S17N. (e) Confocal images showing the colocalization of GFP-KRas4a WT or GFP-KRas4b WT with LAMP1 in HEK293T cells. Quantification of colocalization was shown on the left using Pearson’s coefficient (n = 10 for each sample). Statistical evaluation was done using a two-way ANOVA. Scale bar: 5 μm.

