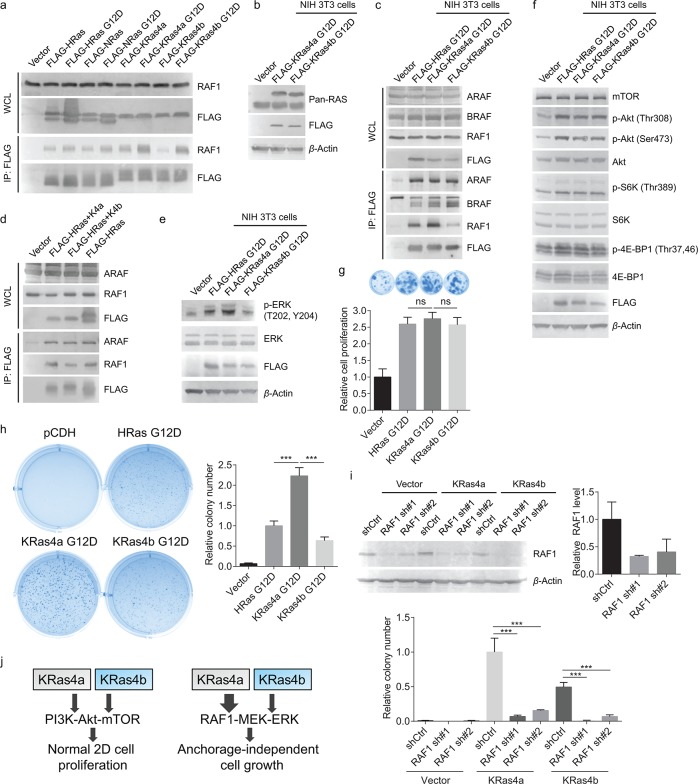
Figure 4.
KRas4a has more RAF1 interaction than KRas4b in cells. (a) Detection of interactions between endogenous RAF1 and FLAG-tagged WT and G12D mutants of HRas, NRas, KRas4a, and KRas4b in HEK293T cells. (b) FLAG-tagged KRas4a/b G12D and endogenous Ras expression levels in NIH 3T3 cells. FLAG-tagged KRas4a/b had higher molecular weight than endogenous Ras and ran higher on the gel. (c) Immunoprecipitation of FLAG-tagged KRas4a G12D pulled out more endogenous RAF1, but not ARAF and BRAF, than FLAG-tagged HRas G12D and KRas4b G12D did in NIH 3T3 cells. (d) Immunoprecipitation of FLAG-tagged HRas(1–164)-KRas4a(165–189) pulled out more endogenous RAF1 than FLAG-tagged HRas(1–164)-KRas4b(165–188) did in HEK293T cells. (e) p-ERK (Thr202, Tyr204) and ERK levels in NIH 3T3 cells expressing pCDH vector, FLAG-tagged HRas G12D, KRas4a G12D, or KRas4b G12D. (f) FLAG-tagged HRas G12D, KRas4a G12D, and KRas4b G12D increased the phosphorylation levels of several key proteins (p-Akt Thr308, p-Akt Ser473, p-S6K Thr389, and p-4E-BP1 Thr37,46) in the PI3K-Akt-mTOR pathway to similar extents in NIH 3T3 cells. (g) Normal 2D cell proliferation of NIH 3T3 cells expressing pCDH vector, FLAG-tagged HRas G12D, KRas4a G12D, or KRas4b G12D. Statistical evaluation was examined using an unpaired two-tailed Student t test. Error bars represent SD in three biological replicates. (h) Anchorage-independent soft agar assay showing that KRas4a G12D expressing NIH 3T3 cells had higher colony number than HRas G12D or KRas4b G12D expressing NIH 3T3 cells. Statistical evaluation was examined using an unpaired two-tailed Student t test. Error bars represent SD in three biological replicates. ***P < 0.001. (i) Knocking down RAF1 by two different shRNAs dramatically decreased KRas4a G12D and KRas4b G12D induced colony formation in soft agar assay. Top figure shows the Western blot of endogenous RAF1 in empty vector, KRas4a G12D, or KRas4b G12D expressing NIH 3T3 cells and the quantification of bands on the Western blot membrane. Statistical evaluation was examined using an unpaired two-tailed Student t test. Error bars represent SD in three biological replicates. ***P < 0.001. (j) Scheme showing that in NIH 3T3 cells, increased KRas4a-RAF1 interaction may contribute to increased anchorage-independent cell growth.

